
On-chain metrics are quantitative measurements derived from data visible on a blockchain’s public ledger. Unlike traditional financial indicators that pull from corporate balance sheets or market exchanges, on-chain metrics capture actual blockchain activity: every transaction, every wallet movement, every smart contract interaction lives permanently on the network. For crypto investors, this is a shift — you can see how users actually behave with a particular digital asset, not just how they claim to feel in surveys or social media.
This matters because on-chain data shows actions, not intentions. Someone might tweet optimistically about a cryptocurrency while simultaneously moving their holdings to an exchange — behavior that on-chain analysis catches instantly. These metrics are useful for investors trying to cut through market noise and identify genuine network health or potential weakness.
This guide covers the most important on-chain metrics, explains how professional investors interpret them, and provides practical frameworks for incorporating blockchain data into your own investment process.
What Are On-Chain Metrics?
On-chain metrics are data points that describe activity occurring directly on a blockchain network. Because blockchains are transparent ledgers — anyone can view the entire history of transactions — analysts can aggregate this raw data into meaningful indicators. These metrics reveal patterns in user behavior, network usage, and capital flows that would be impossible to observe in traditional markets.
The distinction between on-chain data and off-chain data matters more than most beginners realize. Stock markets have exchanges, clearinghouses, and brokerages standing between you and the actual transfer of shares. Crypto markets, by contrast, settle directly on-chain in many cases, meaning the blockchain record is the definitive source of truth. When a wallet sends 10 Bitcoin to another wallet, that transaction exists permanently on the Bitcoin blockchain. No intermediary can alter it, and the details — amount, timing, sender, receiver — are visible to anyone who knows where to look.
This transparency is what makes on-chain analysis possible. Firms like Glassnode, IntoTheBlock, and CryptoQuant have built businesses around collecting, interpreting, and selling access to these metrics. What was once a niche practice among pseudonymous crypto traders has become a standard part of the institutional investment toolkit.
One thing to keep in mind: on-chain metrics measure real economic activity, not speculative sentiment. This doesn’t make them perfect — the data can be gamed, misinterpreted, or rendered obsolete by changing market structures — but they represent a fundamentally different type of information than price charts or social media trends.
Key On-Chain Metrics Every Investor Should Know
The universe of on-chain metrics is vast, with new indicators emerging as the market evolves. However, a core set of metrics has proven most valuable for investment analysis.
MVRV Ratio
MVRV stands for Market Value to Realized Value, and it represents one of the most widely cited on-chain indicators in crypto investing. The calculation is straightforward: you divide the current market capitalization (the total value of all coins at today’s price) by the realized capitalization (the total value of all coins at the price they last moved).
When MVRV is high — typically above 3.0 for Bitcoin — it suggests that the current price is significantly higher than what most holders paid. This often indicates that a large portion of the supply is in profit, which can signal elevated selling pressure if those holders decide to take profits. When MVRV drops below 1.0, it means the market cap is lower than realized cap — a historically rare occurrence that has often preceded major buying opportunities.
The metric gained prominence through work by crypto analysts including Murad Mahmudov and David Puell, and it’s now standard for anyone analyzing Bitcoin’s relative value. Glassnode tracks MVRV daily, and their dashboard has become a reference point for the industry.
NVT Ratio and NVTS
The Network Value to Transactions ratio, often called the “PE ratio of crypto,” attempts to apply traditional valuation logic to blockchain networks. You calculate it by dividing the network’s market cap by the total transaction volume transmitted through the blockchain over a given period.
The logic is similar to how stock investors might compare price to revenue: a high NVT suggests the network is overvalued relative to its actual usage, while a low NVT might indicate undervaluation. However, this metric has limitations worth acknowledging. High-value transactions on a blockchain don’t necessarily represent “value” in an economic sense — moving coins between wallets isn’t the same as using a network for commercial purposes. Some analysts prefer NVTS (NVT Signal), which uses a moving average of transaction volume to smooth out noise.
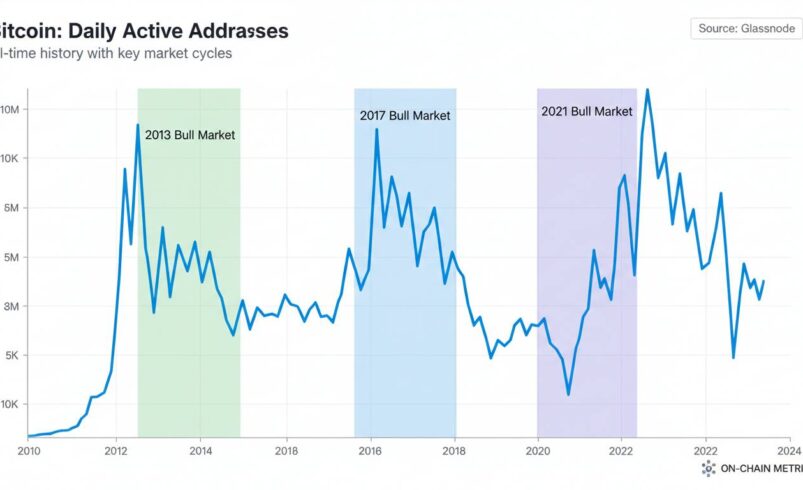
Active Addresses
Active addresses count the number of unique blockchain addresses that participated in transactions during a given period. This metric provides a rough measure of how many individuals are actually using the network.
The challenge with active addresses is that one person can control many addresses, and sophisticated analysis firms have developed heuristics to estimate unique users rather than raw addresses. Still, trends in active addresses tell you something important: whether a network is growing, shrinking, or stagnating in terms of real usage.
A cryptocurrency that sees rising prices but declining active addresses should make you skeptical. Price can be manipulated through limited supply on exchanges, but genuine network adoption requires real users transacting.
Hash Rate
Hash rate measures the total computational power securing a proof-of-work blockchain like Bitcoin. Higher hash rate indicates more miners are participating in the network, which generally means greater security but also higher energy costs.
For investors, hash rate serves as a proxy for miner confidence. When hash rate rises, miners are investing in hardware because they expect the cryptocurrency to remain profitable to mine. When hash rate falls, it often indicates miners are exiting — either because the price dropped too far or because network difficulty adjusted too slowly.
The relationship between hash rate and price isn’t perfectly correlated, but significant divergences can signal opportunities or risks. In late 2022, hash rate remained relatively stable even as Bitcoin’s price crashed, suggesting miners had strong conviction in the network’s long-term viability despite short-term losses.
Exchange Netflow
Exchange netflow measures the net amount of a cryptocurrency moving into or out of exchange wallets. When large amounts of a coin flow into exchanges, it often indicates selling pressure — holders are moving coins to platforms where they can sell them. When coins flow out of exchanges to private wallets, it often suggests accumulation or holding.
This metric requires context to interpret correctly. Some exchanges have very large wallets that can create statistical noise. However, sustained exchange inflows during price rallies can warn that distribution is occurring, while sustained outflows during price declines often precede squeeze scenarios where short sellers cannot find sufficient supply to cover their positions.
Supply in Profit vs. Supply in Loss
This metric divides the total coin supply into two categories: coins that were last moved at a price lower than current market price (in profit) and coins moved at a price higher than current price (in loss). The ratio reveals the distribution of unrealized gains and losses across the entire holder base.
When nearly all coins are in profit, new buyers face the challenge of buying from holders who already have significant returns — a situation that can lead to volatility as early buyers take profits. When most coins are in loss, selling pressure may be exhausted because most holders are underwater and unlikely to sell further, creating conditions for price discovery toward the upside.
Miner Revenue
Miner revenue tracks the total income earned by proof-of-work miners through block rewards and transaction fees. This metric matters because mining is the ultimate marginal buyer of a cryptocurrency — miners must sell a portion of their revenue to cover electricity and hardware costs.
When miner revenue is high relative to price, it suggests strong demand for block space (indicating actual network usage). When miner revenue collapses but price holds steady, it can indicate that price is supported by speculation rather than genuine demand. Miner revenue is particularly useful for understanding the sustainability of a network’s security model.
How Investors Use On-Chain Metrics
Understanding individual metrics is only half the battle. The real value comes from using them together to form a coherent picture of market conditions.
Identifying Market Bottoms and Tops
One of the most practical applications of on-chain metrics is spotting cyclical extremes. MVRV has historically identified major Bitcoin tops and bottoms with reasonable accuracy. The December 2017 Bitcoin top saw MVRV exceed 4.0, while the December 2018 bottom saw MVRV dip below 0.8. Similar patterns appeared around the November 2021 top and the 2022 cycle bottom.
The logic is intuitive: at market tops, everyone who wanted to buy has already bought, and the remaining supply belongs to holders with significant unrealized gains. At market bottoms, capitulation has occurred, and the remaining supply belongs to holders who refused to sell despite massive losses — exactly the kind of diamond-handed participants you want in a market rebound.
However, timing market extremes using MVRV alone is risky. The metric can remain in “overvalued” territory for extended periods during bull markets, and it can stay depressed during extended bear markets. The most effective approach combines MVRV with other indicators and price action confirmation.
Evaluating Network Health
On-chain metrics help investors assess whether a cryptocurrency has genuine usage beyond speculation. Rising active addresses, increasing transaction volumes, and growing hash rate suggest a network that is gaining real adoption. If price is rising but these metrics are flat or declining, you may be looking at a speculative bubble rather than fundamental growth.
This analysis requires comparing similar periods and accounting for seasonality. Transaction volumes tend to spike during bull markets and decline during bear markets regardless of underlying network health. The key is looking at trends over longer timeframes and comparing network growth to price appreciation.
Detecting Distribution and Accumulation
Exchange netflow analysis helps identify when large holders are distributing coins (selling) or accumulating (buying). When exchange inflows spike during price rallies, it often signals that informed holders are using the opportunity to sell into strength. Conversely, when exchange outflows increase during price weakness, it suggests that buyers are stepping in to accumulate at lower prices.
The most sophisticated investors track not just netflow but also exchange reserves — the total amount of a cryptocurrency held on exchanges. Rising exchange reserves can indicate that holders are preparing to sell, while falling reserves often precede supply squeezes.
Informing Entry and Exit Decisions
Some investors build trading systems around on-chain indicators. They might set rules like “accumulate when MVRV falls below 1.0 and exchange outflows exceed inflows” or “reduce exposure when exchange reserves spike during a price rally.” These systems vary in complexity, but they share a common principle: using on-chain data to make decisions based on actual holder behavior rather than price movements alone.
The limitations of this approach deserve acknowledgment. On-chain signals can produce false positives, and the market can remain irrational longer than any system can remain solvent. The most successful investors use on-chain analysis as one input among many, not as a crystal ball.
Why On-Chain Metrics Matter for Crypto Investing
Traditional stock investing has decades of established metrics: P/E ratios, earnings per share, debt-to-equity, and countless others. Crypto markets are younger and less efficient, which means on-chain metrics provide an information advantage that is harder to find in traditional markets.
This advantage stems from blockchain transparency. In stock markets, insider information is illegal to trade on, and most large players have better information access than retail investors. In crypto, the blockchain is equally accessible to everyone. If a whale moves 10,000 Bitcoin to an exchange, you can see it happen in real-time — the same data that analysts at hedge funds see.
The key challenge is interpretation. Raw on-chain data is difficult to parse, and the relationship between specific metrics and price is not always straightforward. Many on-chain indicators that worked in earlier crypto market cycles have become less reliable as the market evolved and traders increasingly monitor the same data. The advantage now belongs to investors who combine on-chain analysis with other research methods and understand the limitations of any single indicator.
For long-term investors, on-chain metrics provide a sanity check. They offer a way to distinguish between assets with genuine network effects and those with price movements driven purely by speculation. In a market known for hype cycles and manipulation, that distinction has real value.
Common Questions About On-Chain Metrics
What is on-chain analysis?
On-chain analysis is the practice of studying data from blockchain networks to understand user behavior, network health, and market conditions. It involves collecting raw blockchain data, processing it into meaningful metrics, and interpreting those metrics to inform investment decisions. On-chain analysis is distinct from technical analysis, which focuses on price and volume patterns, and from fundamental analysis, which typically examines project-level factors like team, technology, and market opportunity.
What are the best on-chain metrics?
The most useful on-chain metrics depend on your investment goals and timeframe. For identifying market cycles, MVRV and realized cap are widely regarded as among the most valuable. For evaluating network adoption, active addresses and transaction volume provide essential insights. For detecting short-term selling pressure, exchange netflow and exchange reserves offer valuable signals. Many investors use a combination rather than relying on any single metric.
How do you read on-chain data?
Reading on-chain data requires accessing blockchain explorers or analytics platforms that aggregate raw data into interpretable formats. Glassnode, IntoTheBlock, CryptoQuant, and Nansen all offer dashboards that visualize on-chain metrics. Beginners should start by tracking a few key metrics over time to understand their normal ranges and how they behave during different market conditions. Comparing current values to historical extremes helps put today’s numbers in context.
Can on-chain metrics predict price movements?
On-chain metrics can identify conditions that historically precede price movements, but they cannot predict the future with certainty. They work best as probabilistic indicators — when MVRV is extremely high, the probability of a correction increases, but the timing and magnitude remain uncertain. The most effective approach treats on-chain analysis as one component of a broader research framework rather than a standalone prediction tool.
Conclusion
On-chain metrics represent a genuinely new type of financial data. For the first time in market history, investors can observe the actual behavior of market participants through a transparent, tamper-proof record. This creates opportunities that don’t exist in traditional markets — but it also requires learning new frameworks and accepting new limitations.
The metrics covered here — MVRV, NVT, active addresses, hash rate, exchange netflow, and others — form the foundation of on-chain analysis. Start by tracking a few key indicators over time before attempting to incorporate all of them into your decision-making process. The relationships between metrics matter more than any individual number.
What remains unresolved, and what every investor must ultimately grapple with, is the question of how much weight to give on-chain signals relative to other forms of analysis. The market continues to evolve, and indicators that worked brilliantly in 2017 may not perform the same way in future cycles. Building your own framework through careful observation and iteration is the only approach that has consistently proven effective.


