If you’re investing for income, the dividend payout ratio is a metric worth understanding—though “single most important” might be overstating it. I’ve seen plenty of investors chase attractive 8% yields only to watch those distributions get cut or eliminated entirely, and the payout ratio is usually the reason why. It tells you whether a company is returning a reasonable portion of earnings to shareholders or essentially borrowing from tomorrow to pay you today. Get this wrong, and your “income investment” becomes a value trap. Get it right, and you have a reliable cash flow engine for decades.
This guide covers what the payout ratio means, how to calculate it, what counts as healthy for different industries, and the red flags that signal a dividend is heading for trouble. I’ll also explain why sometimes a 100% payout ratio is safer than a 40% one—and why context matters more than the raw number.
What Is a Dividend Payout Ratio?
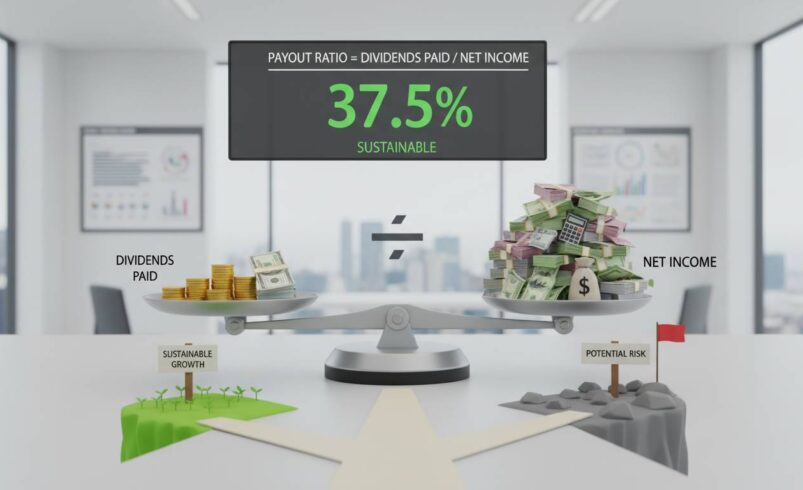
The dividend payout ratio measures the percentage of a company’s earnings paid out to shareholders as dividends. In plain English: out of every dollar this company earned, how much did it actually give back to investors?
A company that earns $5 per share and pays $2 in annual dividends has a payout ratio of 40%. That means 60% of earnings were retained by the company to reinvest in the business, pay down debt, or build cash reserves. A company earning $5 per share that pays $5 in dividends has a 100% payout ratio—every dollar of earnings went to shareholders, leaving nothing retained.
This ratio is your window into dividend sustainability. If a company consistently pays out more than it earns, that’s mathematically impossible without external funding. Either the dividend gets cut, the company takes on debt, or it depletes its cash reserves. None of those outcomes are good for income investors.
The payout ratio also reveals dividend growth potential. A company paying out only 25% of earnings has plenty of room to increase its dividend over time without straining finances. A company paying 90% has almost no flexibility—the next earnings dip could force a cut.
How to Calculate the Dividend Payout Ratio
You’ll need two numbers: dividends per share (DPS) and earnings per share (EPS). The formula:
Dividend Payout Ratio = (Dividends Per Share ÷ Earnings Per Share) × 100
Let’s look at a real example using Apple (AAPL). As of early 2025, Apple pays a quarterly dividend of $0.24 per share, totaling $0.96 annually. Apple’s trailing twelve-month earnings per share sits around $6.10. Doing the math:
($0.96 ÷ $6.10) × 100 = 15.7%
Apple’s payout ratio of roughly 16% is extremely low. The company retains over 80% of its earnings to fund growth, buy back shares, and build one of the largest cash hoards in corporate America. This gives Apple enormous flexibility to raise its dividend substantially in the future.
Now consider AT&T (T), a stock that has historically attracted income investors. AT&T’s dividend of approximately $1.11 per share against earnings around $2.40 per share gives a payout ratio of about 46%. That looks manageable on the surface, but AT&T’s earnings have been volatile due to debt obligations and strategic shifts—the ratio spiked above 100% in some years, leading to the dividend cut announced in 2021.
Don’t calculate the payout ratio just once. Look at the five-year trend. A company with a consistently low ratio that occasionally spikes is less concerning than one with a ratio that steadily climbs toward (or past) 100%.
What Is a Good Dividend Payout Ratio?
Here’s where things get tricky: there’s no universal “good” payout ratio. A healthy ratio in banking would be a disaster in technology, and vice versa.
In the utility industry, companies like Duke Energy (DUK) and Southern Company (SO) routinely operate with payout ratios between 60% and 80%. Utilities are slow-growth businesses with predictable, regulated revenue streams. They don’t need to retain much earnings because their growth opportunities are limited. Investors expect and receive steady, reliable distributions.
Tech giants like Microsoft (MSFT) and Apple operate with payout ratios under 30%. These companies generate massive cash flows but also face rapid technological change and substantial reinvestment needs. Returning too much capital would leave them vulnerable to competitors. Their shareholders benefit more from stock price appreciation and modest but growing dividends.
For most dividend investors, a payout ratio between 40% and 60% strikes a reasonable balance. This range suggests the company is sharing profits with shareholders while retaining enough to weather downturns and fund moderate growth. However, this is a guideline, not a rule.
The most important question isn’t “what is a good payout ratio?” but rather “is this payout ratio sustainable for this specific company in this specific industry?” That requires looking at cash flow stability, debt levels, capital expenditure requirements, and the company’s dividend history.
Why a High Payout Ratio Isn’t Always Bad (And Why a Low One Isn’t Always Safe)
A high payout ratio can sometimes be safer than a low one, depending on the business model.
Realty Income (O), the “Monthly Dividend Company,” consistently operates with payout ratios above 80%—sometimes approaching 90%. By conventional standards, this should be a red flag. But Realty Income owns net-lease real estate: freestanding retail buildings leased to companies like Walgreens, Dollar General, and FedEx. These leases are long-term, contractually guaranteed, and often include rent escalations. The rental income is extraordinarily predictable.
Realty Income’s payout ratio looks high on paper, but it’s calculated against accounting earnings that include non-cash depreciation. Its actual cash flow coverage is much stronger. The company has raised its dividend 121 times since going public in 1994—an incredible track record that shows the metric must be interpreted in context.
Now consider a manufacturing company with a 30% payout ratio. If that company’s earnings are volatile—tied to commodity prices, cyclical demand, or a narrow product line—then a 30% payout ratio today could become 60% or 80% next year when earnings drop. The ratio alone doesn’t tell you whether earnings are stable or erratic.
The takeaway: always pair the payout ratio with analysis of earnings quality, cash flow consistency, and the fundamental economics of the business. No single metric tells the whole story.
Red Flags: When a Dividend Is at Risk
Beyond the payout ratio, several warning signs suggest a dividend cut is coming.
The ratio exceeds 100% for multiple years. This is the most obvious red flag. A company cannot mathematically sustain payouts exceeding earnings forever. If you see a payout ratio above 100%, dig into why—often it’s a sign of earnings decline rather than dividend generosity.
Earnings are declining but the dividend hasn’t been cut. Management teams sometimes delay dividend cuts to avoid signaling weakness. If earnings have dropped 20% over two years but the dividend remains flat, the payout ratio is climbing, and the unsustainable situation will eventually resolve painfully.
Free cash flow consistently lags behind dividend payments. Earnings are accounting figures; cash is reality. A company can report “earnings” while actually burning cash if receivables are swelling and inventory is piling up. Free cash flow—the actual cash generated after capital expenditures—provides a clearer picture of dividend sustainability. If free cash flow per share is below the dividend per share, that’s a serious warning.
Debt levels are rising while the dividend stays the same. Companies funding dividends through borrowing are borrowing from tomorrow. Look at the debt-to-equity ratio and interest coverage. If a company is taking on debt just to maintain its dividend, the situation is fragile.
Management signals optimism that conflicts with the numbers. Listen to earnings calls. If executives are talking about “investing in growth” while the payout ratio climbs past 80% and free cash flow turns negative, they’re not being honest with shareholders. Dividend sustainability requires alignment between what management says and what the numbers show.
How to Tell If a Dividend Is Sustainable
Assessing dividend sustainability requires a multi-step framework, not just looking at the payout ratio in isolation.
Step 1: Calculate the five-year average payout ratio. One year of unusual earnings can distort the ratio. Look at the trend over time. A company with a 60% average payout ratio that occasionally spikes to 75% during boom years is different from one with a steadily climbing ratio that never comes back down.
Step 2: Check free cash flow payout ratio. Replace earnings with free cash flow in your calculation. If the company pays $2 per share in dividends but generates only $1.50 in free cash flow per share, the dividend is being funded partially through debt or asset sales. That’s not sustainable.
Step 3: Examine the dividend coverage ratio. This is simply the inverse of the payout ratio—a coverage ratio of 2.0x means earnings are double the dividend. Look for coverage of at least 1.5x to provide a cushion during bad years.
Step 4: Assess industry fundamentals. Ask yourself: does this company’s business model generate predictable, recurring cash flows? Utilities, telecom infrastructure, and real estate investment trusts generally have stable cash flows. Cyclical companies like automakers, energy producers, and retailers do not. The same payout ratio means different things in different contexts.
Step 5: Review dividend history. How many times has this company raised its dividend? How many times has it been cut? A company with a 25-year history of consecutive dividend increases (what’s called a “dividend aristocrat” or “dividend king”) has demonstrated commitment to shareholder returns through multiple economic cycles. That’s worth paying a premium for.
Step 6: Look at the yield relative to history. A suddenly elevated yield—say, 7% when the stock has historically yielded 3-4%—often signals trouble. The stock price dropped, which means the market is pricing in a dividend cut. Don’t confuse a “high yield” with a “good yield.”
Dividend Payout Ratios by Industry
Different industries have fundamentally different relationships with dividend payouts. Here’s a practical breakdown:
| Industry | Typical Safe Range | Why |
|---|---|---|
| Utilities | 60-80% | Stable, regulated revenue; limited growth needs |
| Telecom | 50-70% | Predictable cash flows but capital-intensive |
| REITs | 75-95% | Required to distribute 90% of earnings; focus on FFO |
| Banks | 50-75% | Regulated capital requirements; stable earnings |
| Consumer Staples | 40-60% | Moderate growth, defensive through recessions |
| Energy | 40-80% | Highly cyclical; varies with commodity prices |
| Technology | 20-40% | High growth reinvestment needs; rapid change |
| Healthcare | 30-50% | R&D requirements; long product cycles |
REITs and utilities operate at what would seem like “dangerous” levels in other industries. That’s because their business models are fundamentally different—the rules don’t apply the same way.
When comparing companies, always benchmark against their industry peers. Comparing a tech company’s 25% payout ratio favorably to a utility’s 70% ratio makes no sense. They’re different businesses with different cash flow characteristics.
Frequently Asked Questions
Is a 100% payout ratio bad?
Not necessarily. A 100% payout ratio means the company is paying out all earnings as dividends—leaving nothing for reinvestment. This is sustainable only if the company has minimal growth opportunities, extremely stable cash flows, and perhaps a business model (like certain REITs) that requires high distributions. For most companies, a sustained 100%+ ratio is a warning sign that the dividend will eventually be cut. However, some master limited partnerships (MLPs) and REITs are designed to pay out nearly all cash flow, so context matters enormously.
What is the ideal payout ratio for dividend growth investing?
For dividend growth investors—those looking for companies that consistently raise their dividends each year—a payout ratio between 30% and 60% is generally ideal. This provides room for dividend increases even if earnings grow slowly, while still returning meaningful cash to shareholders. Companies like Johnson & Johnson (JNJ), Procter & Gamble (PG), and Microsoft (MSFT) all fit this profile, with ratios in the 40-55% range and decades of consecutive dividend increases.
Can the payout ratio be negative?
Yes. A negative payout ratio occurs when a company pays a dividend but reports negative earnings (a loss). This is inherently unsustainable and almost always precedes a dividend cut. You’ll sometimes see this with startups, highly cyclical companies in downturns, or firms in restructuring. Avoid treating negative-earnings dividends as permanent income sources.
Should I use forward earnings or trailing earnings?
Forward (estimated) earnings give you a more current picture of what the payout ratio likely looks like going forward, while trailing earnings are actual reported results. For dividend sustainability analysis, I prefer looking at both: trailing earnings show what actually happened, while forward estimates show what management and analysts expect. If the forward payout ratio looks sustainable but the trailing ratio spiked above 100%, that’s worth investigating.
Conclusion
The dividend payout ratio is your first line of defense against dividend cuts and yield traps, but it’s not a complete solution on its own. The companies that build lasting wealth for income investors don’t just look at one number—they understand the business model behind the number, the cash flow reality, and the industry context.
A dividend yield is a relationship between the dividend and the stock price, while the payout ratio is a relationship between the dividend and earnings. The yield can change instantly with stock price movements. The payout ratio tells you whether the dividend itself is on solid ground. Prioritize that analysis, and you’ll avoid the high-yield traps that catch so many income investors.
No metric perfectly predicts dividend safety. Even excellent companies can face unforeseen challenges that force cuts. But by systematically evaluating payout ratios, cash flow coverage, and business model stability, you’ll dramatically improve your odds of holding onto your income through market turbulence. The best dividend investors aren’t looking for the highest yield—they’re looking for the most reliable income stream over a multi-decade time horizon.