
Most investors treat the P/E ratio like a simple pass/fail test — if the number is low, they buy; if it’s high, they walk away. That’s a mistake that costs money. The P/E ratio isn’t a verdict on whether a stock is cheap or expensive. It’s a question posed in mathematical form: what does the market believe about this company’s future earnings power relative to what you’re paying today? Understanding how to read that question — and when the market’s answer might be wrong — is what separates investors who build lasting wealth from those who chase hot stocks into the ground.
This guide walks through what the P/E ratio measures, how to calculate it correctly, how to interpret it across different sectors and market conditions, and most importantly, where it leads you astray. By the end, you’ll have a working framework for using this metric without falling into the traps that catch most people.
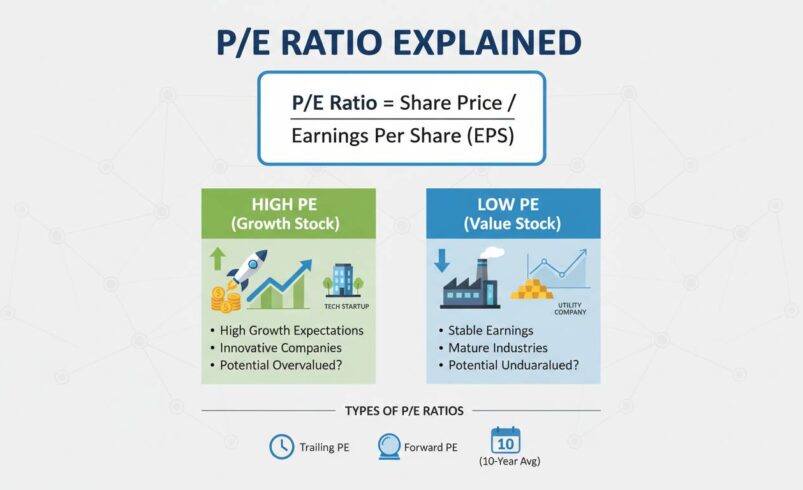
The price-to-earnings ratio measures the relationship between a company’s stock price and its earnings per share. It tells you how much investors are willing to pay for each dollar of the company’s earnings. A P/E of 20 means the market values the company at twenty times its annual earnings. Simple enough in concept, but interpretation gets messy quickly because “earnings” can mean different things, and “reasonable” varies dramatically by industry.
To calculate it, you divide the current share price by either trailing twelve-month earnings per share (EPS) or forward-looking EPS estimates. The first approach uses actual reported earnings — what’s already in the books. The second uses what analysts expect the company to earn in the coming year. Neither is inherently superior; each tells you something different about what the market is pricing in.
As a concrete example, as of late 2024, Microsoft trades around $370 per share with trailing EPS of approximately $11.80. That gives a trailing P/E of about 31.4. Compare that to Chevron, trading near $150 with trailing EPS around $8.50, producing a P/E of roughly 17.6. Does this mean Microsoft is overpriced and Chevron is the bargain? Not necessarily. Microsoft grows earnings at roughly 15-20% annually. Chevron’s growth prospects are closer to 3-5%. The market prices in those different trajectories, which is exactly what the P/E ratio reflects — but only if you know how to read it in context.
How to Calculate P/E Ratio Correctly
The basic formula is straightforward: share price divided by earnings per share. But the denominator has two valid interpretations, and choosing the wrong one leads to fundamentally different conclusions about the same stock.
Trailing P/E uses reported earnings from the last twelve months. This number is concrete — it’s what the company actually earned, not what analysts predict it might earn. However, trailing P/E can be stale, especially for fast-growing companies where last year’s earnings barely resemble what’s happening now. If a company underwent a transformation in the past six months, trailing P/E will still be looking at the old version of the business.
Forward P/E uses analyst estimates for the next twelve months. This gives you a sense of what the market expects going forward, but it’s based on predictions that may not pan out. Companies that consistently beat earnings estimates will show a forward P/E that looks cheaper than it actually is because the estimates are conservative. Conversely, companies with declining earnings that analysts expect to recover will show a forward P/E that looks cheaper than the trailing version suggests — but only if the recovery actually happens.
You also need to be careful about which EPS figure you’re using. Some sources use diluted EPS, which accounts for all outstanding stock options, warrants, and convertible securities that could become common shares. Others use basic EPS, which ignores these instruments. For most large publicly traded companies, diluted EPS is the more accurate measure because it reflects the full economic exposure of all shareholders.
One practical tip: when comparing P/E ratios across companies, ensure you’re using the same methodology for each. Mixing trailing with forward, or diluted with basic, produces comparisons that are apples-to-oranges at best and misleading at worst.
What High and Low P/E Ratios Actually Mean
The common shorthand is that low P/E means undervalued and high P/E means overvalued. This isn’t wrong, but it’s dangerously incomplete. A P/E ratio is fundamentally a statement about growth expectations, risk, and market sentiment — all wrapped into a single number.
A stock with a P/E of 50 is telling you that investors collectively expect significant earnings growth from this company. They’re willing to pay $50 today for every $1 of current earnings because they believe that $1 will grow to $2, $3, or more over time. The high P/E is a bet on future growth. If that growth materializes, the price was justified. If it doesn’t, the stock crashes.
Conversely, a stock with a P/E of 8 is signaling that investors expect minimal growth — or potentially decline. They’re paying $8 for each dollar of current earnings because they don’t expect that dollar to get much bigger. This can represent a genuine bargain if the company is healthier than the market believes, but it can also be a value trap where the earnings keep shrinking and the P/E stays low not because the stock is cheap, but because the denominator is collapsing.
Consider Amazon as a teaching moment. For years, Amazon traded at P/E ratios that would make traditional investors cringe — sometimes exceeding 100. Was the stock perpetually overvalued? By conventional metrics, yes. But Amazon was aggressively reinvesting earnings into new businesses (AWS, Prime, logistics infrastructure) that traditional earnings measurements didn’t capture. The P/E ratio was essentially useless as a valuation tool for Amazon because it measured the wrong thing for that particular business model.
This is why the P/E ratio in isolation tells you almost nothing. You need to compare it to what the company actually does, what the broader sector trades at, and what growth rate would be required to justify the current price.
What Counts as a “Good” P/E Ratio
There’s no universal number that makes a P/E ratio good or bad. A P/E of 15 might be a steal for a bank and absurdly expensive for a software company. Context determines everything.
The most useful comparison is against a company’s historical P/E range. If Apple has traded between 15 and 35 over the past decade, a P/E of 25 tells you it’s neither obviously cheap nor obviously expensive — it’s in the middle of its normal range. What matters is whether something has changed to justify moving outside that range, positive or negative.
Sector comparison is equally important. As of early 2025, consumer staples companies typically trade in the 15-20 range because they’re slow-growing but stable. Technology companies often command 25-40+ because their growth rates justify the premium. Energy companies swing wildly based on oil prices, often trading in single digits during downturns and hitting 15+ during boom cycles. Comparing a tech stock’s P/E to a utility’s P/E is meaningless — it’s like comparing a sprinter’s heart rate to a marathon runner’s.
The PEG ratio improves on raw P/E by factoring in growth. You calculate it by dividing the P/E ratio by the company’s expected earnings growth rate (expressed as a whole number). A PEG of 1 is considered fairly valued. Below 1 suggests potential undervaluation; above 1 suggests you’re paying a premium for the growth you’re getting. A company with a 30 P/E growing earnings at 20% annually has a PEG of 1.5 — more expensive than it appears on raw P/E alone. A company with a 12 P/E growing at 5% has a PEG of 2.4 — actually pricier than the low P/E suggests.
This framework is useful, but it has limits. It breaks down for companies with negative earnings (growth companies in early stages) and doesn’t account for the quality or sustainability of that growth. Use it as one input among many, not a final answer.
When P/E Ratio Fails as a Metric
Here’s where I want to push back on conventional wisdom: the P/E ratio gets presented as a foundational valuation metric, and it is, but it fails in more common scenarios than most investing guides admit. Understanding when not to trust it matters as much as knowing how to calculate it.
Debt distorts everything. A highly leveraged company can show a low P/E while being资产负债表ically weak. Say a company earns $100 million annually but carries $2 billion in debt. The market price reflects the debt burden, and the earnings figure doesn’t subtract interest costs in a way that fully accounts for risk. The low P/E might look attractive, but the company is one recession away from trouble. Look at the balance sheet before deciding the P/E makes a stock cheap.
Earnings are accounting, not cash. Companies can manipulate earnings through depreciation schedules, revenue recognition timing, and one-time charges or gains that get added back to “adjusted” earnings. A company that reports healthy earnings but burns cash might have a P/E that looks reasonable while the actual business is deteriorating. Always check free cash flow alongside earnings.
Cyclical companies break the model. Airlines, auto manufacturers, and commodity producers swing between massive profits and losses depending on the economic cycle. During boom years, their P/E ratios look rock-bottom cheap — but that’s because earnings are temporarily high. During downturns, P/E can go negative or become meaningless. For these sectors, you need to normalize earnings over a full cycle rather than looking at a single year’s P/E.
Growth at any price is a religion. The late 1990s tech bubble featured companies with P/E ratios of 100, 200, even 500. The logic was that growth was so fast the earnings would “catch up.” Some did — Microsoft, Amazon — and made early investors fortunes. Most didn’t, and their stocks collapsed by 90% or more. The lesson isn’t that high P/E is always wrong; it’s that the market can be wrong about growth expectations, and when it is, the downside is severe.
Using P/E Ratio With Other Metrics
No serious investor relies on a single metric. The P/E ratio works best as a screening tool and a component of a broader analysis framework. Here’s how to layer it with other approaches.
Price-to-sales (P/S) ratio helps when earnings are volatile or nonexistent. A biotech company with no profit yet still has a value — it’s the revenue pipeline that matters. P/S gives you a way to compare those situations.
Price-to-book (P/B) ratio matters most for financial institutions, real estate, and asset-heavy businesses. Banks trade largely on book value because their assets and liabilities are marked to market. A bank trading below book value might be a bargain or might be signaling unrecognized losses on loan portfolios.
Free cash flow yield — free cash flow divided by market cap — captures what the company actually generates in cash rather than accounting earnings. A company with a low P/E but poor cash flow might be less attractive than one with a higher P/E but strong cash generation.
Return on equity (ROE) tells you how efficiently the company turns shareholder capital into earnings. A company with a 30 P/E and 25% ROE is very different from one with a 30 P/E and 8% ROE. The first is expensive but efficient; the second might be mediocre.
The point isn’t to find a stock that looks good on every metric. It’s to understand why a particular number looks the way it does and whether the story behind it makes sense.
Practical Application
Let’s walk through how this plays out with a real decision. Say you’re comparing two hypothetical companies in the same sector:
Company A trades at $50 per share with EPS of $2.50, giving a P/E of 20. Company B trades at $80 per share with EPS of $2.00, giving a P/E of 40. At first glance, Company A looks cheaper.
But dig deeper. Company A is mature, generates $500 million in annual free cash flow, and pays out most of it as dividends. Earnings have grown 3% annually for five years. Company B generates $200 million in free cash flow but is reinvesting aggressively. Earnings have grown 25% annually as it takes market share. The dividend is negligible.
The “expensive” stock might actually be the better value if that growth continues. The “cheap” stock might be a value trap where earnings start declining. The P/E ratio alone can’t tell you which story is right — but it can prompt the right questions.
Conclusion
The P/E ratio is a powerful tool for understanding what the market expects from a company and whether those expectations are reasonable given its growth prospects, competitive position, and financial health. It’s not a shortcut to finding undervalued stocks, and it’s not a gatekeeper that tells you what to avoid. It’s a starting point — a question about value that demands investigation rather than a final answer.
What separates skilled investors from amateurs isn’t avoiding high P/E stocks or gravitating toward low ones. It’s understanding what the P/E ratio is actually communicating about the market’s expectations and having the judgment to assess whether those expectations are justified. That judgment comes from studying individual businesses, understanding sector dynamics, and being honest about what you don’t know. The ratio will tell you what others think. What you do with that information is where investing skill lives.


