
The first time I opened a company’s annual report, I felt like I was staring at a foreign language. Pages of dense financial tables, legal disclaimers that went on forever, and a glossy letter from the CEO that read like half a sales pitch and half a philosophy lecture. That was fifteen years ago. I’ve since read hundreds of these things as an analyst and an investor, and here’s what I wish someone had told me on day one: you don’t read an annual report like a novel. You read it like a reference document. Knowing how to pull the signal out of the noise is what separates investors who actually do their homework from the ones who just chase headlines.
This guide walks you through the sections that matter, explains what to look for in each one, and shows you how to spot opportunities and warning signs. You’ll learn to read these documents the way professionals do—not as a chore, but as your single most valuable source of company-specific research.
What Exactly Is an Annual Report?
An annual report is a comprehensive document that publicly traded companies are required to file with the SEC and send to shareholders. It tells the story of a company’s financial performance over the past fiscal year, but more importantly, it provides the context behind those numbers.
Here’s the distinction many beginners miss: the annual report you receive as a shareholder is usually a polished, shorter version of what’s actually filed with the regulator. The full, legally authoritative document is called a 10-K, and that’s the version serious investors use. You can find any public company’s 10-K for free on the SEC’s EDGAR database (sec.gov/edgar).
The shareholder version is typically 30-60 pages. The 10-K can run 100 pages or more. Both contain the same core financial information, but the 10-K includes additional disclosures, legal footnotes, and detailed breakdowns. As a new investor, start with the shorter version—but know that the 10-K is there if you need more detail.
Companies usually release their annual reports within 60-90 days of their fiscal year ending. For most companies with a December year-end, you’ll see them drop in February or March. One thing to keep in mind: you’re reading about performance that ended months ago. By the time you see the report, the market has already had time to react.
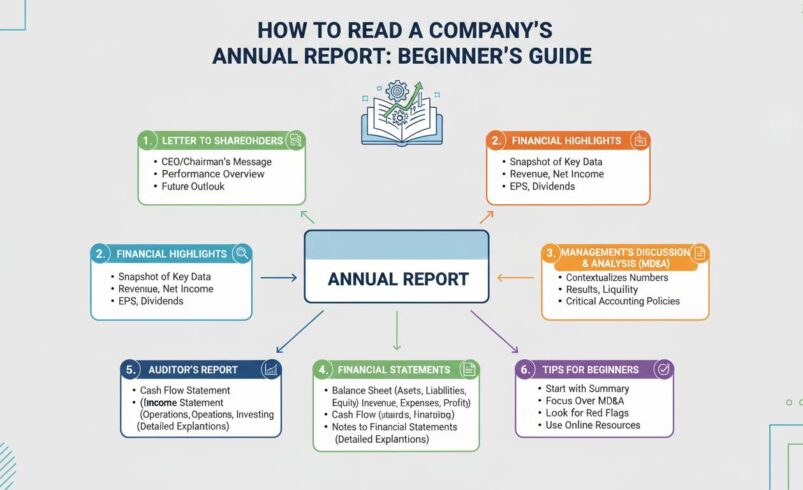
The Five Main Sections You Need to Understand
Every annual report follows a roughly similar structure. Knowing this architecture before you dive in saves a ton of time. Here are the five sections that deserve your attention, roughly ordered by how much time you should spend on each:
-
Financial Statements — The three core statements (income statement, balance sheet, cash flow) are the backbone of the entire document. These contain the actual numbers. Everything else is context.
-
Management’s Discussion and Analysis (MD&A) — This is where management explains what happened, why the numbers look the way they do, and what they’re expecting going forward. It’s written by the company about the company, so read it with some skepticism—but it’s invaluable for understanding their narrative.
-
Notes to Financial Statements — These are the footnotes. Most people skip them. That’s a mistake. The notes explain accounting policies, break down line items, disclose legal matters, and reveal contingencies that could materially affect the business. Serious investors spend a lot of time here.
-
Letter to Shareholders — The CEO’s letter sets the tone. It rarely contains hard financial data, but it reveals management’s priorities, communication style, and confidence level. A letter that avoids discussing challenges is a warning sign.
-
Corporate Governance and Board Information — Who’s running the company, how they’re compensated, and what controls exist to protect shareholder interests. This matters more than most beginners realize.
The remaining sections—auditor reports, internal control disclosures, legal disclaimers—are important but less critical for initial analysis. Now let’s go deeper into the sections that actually move the needle.
The Letter to Shareholders: More Than Fluff
The CEO’s letter sits at the front of every annual report, and it’s the section most likely to be stuffed with corporate buzzwords and optimistic language. Don’t dismiss it entirely, but learn to read it strategically.
What you’re looking for is tone consistency. Does the letter acknowledge real challenges, or does it read like a permanent victory lap? In Apple’s 2023 annual report, CEO Tim Cook discussed supply chain disruptions and macroeconomic headwinds alongside product launches. That acknowledgment of difficulty, even in a successful year, signals maturity. Compare that to companies whose letters mention only wins and never mention anything that went wrong. Either they’re lying to you, or they don’t understand their own business.
Pay attention to what gets prominence and what gets buried. If a CEO spends three paragraphs discussing a new product initiative but gives one sentence to a declining revenue segment, that’s information about their priorities. It doesn’t mean the declining segment is unimportant—it means management may be hoping you won’t notice.
The letter also reveals management’s communication style. Some CEOs write plainly and directly. Others write in carefully lawyered language that reveals almost nothing. If you find yourself unable to extract any concrete information about strategy or performance from the letter, that’s actually useful information about how this company communicates with its owners.
Financial Statements: The Three Documents That Actually Matter
This is where the annual report earns its keep. The three financial statements—income statement, balance sheet, and cash flow statement—tell you what happened financially. Together, they form a complete picture that no single statement can provide alone.
The Income Statement
The income statement shows revenue, expenses, and profit over a specific period. You know the basic structure: top-line revenue minus various expenses equals net income at the bottom. But here’s what beginners often miss.
Revenue isn’t always what it seems. Companies can recognize revenue differently, and the footnotes explain how. If a company reports $10 billion in revenue but the notes reveal that $3 billion came from long-term contracts recognized upfront, you need to know that to assess quality. A company with $7 billion in “organic” revenue is performing differently than one with $10 billion that includes accounting maneuvers.
Look at the trend, not just the current year. Amazon’s income statement shows periods where the company reported net losses even as revenue grew dramatically. A naive reader might conclude Amazon was struggling. The sophisticated reader understands Amazon was investing heavily in growth, and losses were a choice, not a sign of failure. Context matters, and the income statement alone doesn’t provide it—that’s why you read the MD&A alongside it.
Focus on these line items: revenue growth rate, gross margin, operating income, and earnings per share. Compare each to the prior year and to analyst expectations if you can find them. A company that beats expectations consistently is doing something right. One that misses consistently is signaling problems.
The Balance Sheet
If the income statement is a movie, the balance sheet is a photograph. It shows what the company owns and what it owes at a single moment in time—the last day of the fiscal year.
The fundamental equation is assets equals liabilities plus equity. Everything the company has (assets) was either bought with borrowed money (liabilities) or paid for by owners (equity). This has to balance, hence the name.
What to look for: Is the company accumulating debt faster than equity? That’s a warning sign unless the debt is financing rapid, high-return growth. Consider Apple’s balance sheet in recent years—Apple carries significant debt, but it’s deliberately borrowed money at low interest rates to fund share buybacks and dividends. The debt isn’t a sign of distress; it’s a financial engineering decision. The key is whether the assets generate enough return to service that debt comfortably.
Check the current ratio (current assets divided by current liabilities). This measures whether the company can pay its short-term obligations. A ratio below 1.0 for an extended period suggests liquidity problems. Most healthy companies maintain ratios well above 1.0, though this varies by industry—retail companies like Walmart typically have lower ratios because their inventory turns over quickly, while software companies often have very high ratios because they hold few physical assets.
Intangible assets are worth examining closely. Modern accounting allows companies to list “goodwill” and other intangible assets that may be vastly overstated relative to their real economic value. When you see $20 billion in goodwill on the balance sheet, ask yourself: what would actually happen if this company had to sell tomorrow? The answer might be very different from what the balance sheet suggests.
The Cash Flow Statement
This is the statement that trips up the most beginners, and it’s arguably the most important of the three. Cash flow tells you what actually happened to money—did it come in, or did it go out?
The income statement uses accounting principles that include non-cash items like depreciation and amortization. A company can report a profit on the income statement while simultaneously running out of cash. This happens more often than you’d think, particularly in rapidly growing companies that are investing heavily in infrastructure.
The cash flow statement has three sections:
Operating cash flow shows cash generated from the core business. This should be positive and, ideally, growing. If a company has been in business for more than five years and consistently shows negative operating cash flow, that’s a serious red flag—you’re looking at a business that may not be viable long-term.
Investing cash flow captures money spent on assets like property, equipment, or acquisitions. This is usually negative for growing companies (they’re investing in the future) and can be positive for mature companies selling off assets. Context matters here more than the raw number.
Financing cash flow reflects money moving between the company and its owners (dividends, share buybacks) and creditors (debt issuance or repayment). A company that consistently shows positive financing cash flow while negative operating cash flow is essentially funded by borrowing or selling shares—that’s usually unsustainable.
Free cash flow—operating cash flow minus capital expenditures—is the metric that matters most for evaluating a company’s real ability to generate cash that could be returned to shareholders. Amazon generated relatively modest net income for years but produced substantial free cash flow from its operations. Investors who focused only on earnings per share missed the actual cash-generation story.
Management’s Discussion and Analysis: Where the Story Unfolds
The MD&A section is where management gets to explain the numbers in the financial statements. It’s required reading, and here’s why: it’s written by the people who actually run the company, and they’re allowed to speak freely in ways that the formal financial statements don’t permit.
In the MD&A, management should address several key questions: What drove revenue changes? What were the significant expenses and why did they increase or decrease? What are the known trends, commitments, and uncertainties that could affect future results? What risks does the company face?
What you’re looking for is specificity. Generic language like “we expect continued growth” tells you nothing. Concrete language like “we expect revenue to grow 8-12% driven by a 15% increase in our cloud segment and stable demand in our retail business” tells you something you can actually use.
One of the most valuable things in the MD&A is the discussion of segment performance. Large companies often break down revenue and profit by business segment, geographic region, or product line. If a company overall shows 5% revenue growth but the MD&A reveals that one segment grew 20% while another declined 10%, you now understand the business much better than before. You’re no longer looking at an aggregate number—you’re seeing the underlying dynamics.
Be alert to what’s missing. If the company faced a significant challenge—a lawsuit, a product recall, a regulatory change—and the MD&A doesn’t address it at all, that’s concerning. Either management is out of touch, or they’re hoping you won’t notice.
Notes to Financial Statements: Where Experts Spend Their Time
I can’t stress this enough: the footnotes aren’t optional reading. They’re where the actual details live. The financial statements themselves are summarized; the notes are where the substance often resides.
The notes explain accounting methods. If a company switched from one accounting method to another, the notes explain why and how it affects the numbers. This matters enormously because a change in accounting methodology can make results look better or worse without any actual change in business performance.
Notes disclose commitments and contingencies. Is the company facing a lawsuit that could result in significant damages? Is there an environmental cleanup obligation? Are there guarantees on debt that isn’t on the balance sheet? These hidden liabilities can bite you later, and the notes are where you’ll find them.
The note on revenue recognition is particularly important for understanding quality of earnings. How quickly does the company collect cash from customers? Are there large amounts of unbilled revenue sitting on the books? Is revenue dependent on a single customer or a small number of customers? These are the questions that determine whether reported earnings are sustainable.
In practice, I spend more time in the notes than in the primary financial statements. The statements tell me the headlines; the notes tell me whether to trust them.
Red Flags: What to Watch For
Experienced investors develop a mental checklist of warning signs that appear repeatedly in annual reports. Here are the ones that matter most.
Revenue growth that outpaces cash flow — If revenue is growing rapidly but the company can’t convert that revenue into cash, something is wrong. The gap might be filled with accounting tricks, or the growth might be unsustainable. Either way, investigate further.
Managing expectations downward — When CEO commentary becomes notably more cautious than in previous quarters, pay attention. Insiders typically know more about the business than outside analysts. If they’re suddenly lowering expectations, the stock price may be about to adjust.
Related-party transactions — Transactions between the company and its executives, board members, or family members of key leaders should make you uncomfortable. These aren’t always problematic, but they require scrutiny, and the notes should disclose them fully.
Changing auditors — When a company fires its auditor or the auditor resigns, it’s often a sign of disagreement over accounting treatments. The SEC requires disclosure of this, and you should treat it as serious.
High executive turnover — If the CFO or other key executives left recently, the annual report might not fully explain why. This is especially concerning if it happens close to the financial reporting deadline.
Debt that grows faster than assets — A company that’s levering up while its asset base shrinks is often signaling that it can’t generate returns any other way. This pattern precedes many blow-ups.
One thing: be skeptical of non-GAAP metrics. Many companies now report “adjusted” earnings that exclude one-time charges, stock-based compensation, or various other items. These adjusted numbers often look much better than GAAP earnings. There’s nothing illegal about reporting non-GAAP figures, but they can be misleading. Always look at the GAAP numbers first, then decide if the adjustments are reasonable.
Key Financial Ratios You Should Know
Ratios transform raw financial statement data into comparable metrics. Here are the ones that matter most for evaluating a company.
Price-to-Earnings (P/E) ratio — This is the most widely followed valuation metric. It compares the stock price to earnings per share. A high P/E might mean investors expect high growth, or it might mean the stock is overpriced. A low P/E might be a bargain or a signal that the company is in trouble. Context is essential.
Debt-to-Equity ratio — Total liabilities divided by shareholder equity. This measures financial leverage. A ratio above 2.0 is high for most industries, though some sectors (banks, for example) naturally run much higher. Compare to industry peers, not to a generic standard.
Return on Equity (ROE) — Net income divided by shareholder equity. This measures how effectively the company uses owner-provided capital. A consistently high ROE (above 15%) suggests a durable competitive advantage. A low or declining ROE suggests competitive pressures.
Gross margin — Revenue minus cost of goods sold, divided by revenue. This tells you pricing power. Companies with wide gross margins often have brand strength or unique products. Declining margins often signal increased competition.
Current ratio — As mentioned earlier, current assets divided by current liabilities. Below 1.0 for extended periods is concerning for most companies.
Free cash flow margin — Free cash flow divided by revenue. This shows how efficiently the company converts revenue into cash that can be returned to shareholders or reinvested. A margin above 10% is strong for most industries.
The key with ratios is to compare them to something meaningful: the company’s own historical performance, direct competitors, or industry averages. A P/E of 25 means nothing in isolation. A P/E of 25 when competitors trade at 35 might represent value—or it might reflect legitimate concerns about the company’s outlook.
Your Next Steps
Reading an annual report is a skill that develops through practice. The first few times will feel slow and uncomfortable. You’ll get lost in the terminology, and you’ll spend more time in the glossary than in the actual content. That’s normal.
Start with a company you already know something about—maybe one where you use the products or services regularly. You’ll find that domain knowledge makes the financial discussion much more comprehensible. When you read that revenue grew because of a new product launch, you’ll know whether that product actually matters.
Don’t try to read the entire annual report in one sitting. Focus on the sections that matter most for your decision: the financial statements, the MD&A, and the notes. Skip around. Use the table of contents. Develop your own system.
The best investors treat annual reports as conversations with management. You’re reading their account of the business, but you’re also learning how they think, how they communicate, and what they choose to emphasize or omit. That context is just as valuable as the numbers themselves.
The annual report is your most powerful tool for independent research. It won’t tell you whether to buy a stock, but it will tell you whether the company you’re considering is worth the effort of deeper analysis. Learn to read it well, and you’ve developed a skill that serves you for your entire investing life.


