
Dividend growth isn’t about finding the highest yield today—it’s about finding companies that have raised their payouts year after year, through bull markets, bear markets, and everything in between. After analyzing dividend growth candidates for over ten years, I’ve learned that the methodology matters more than the result. Get the process right, and the results follow.
This guide walks you through the exact metrics, screening strategies, and tools I use to identify dividend growth stocks with genuine track records. I’ll show you what separates the companies that raise dividends for 25 consecutive years from those that freeze or cut them at the first sign of trouble.
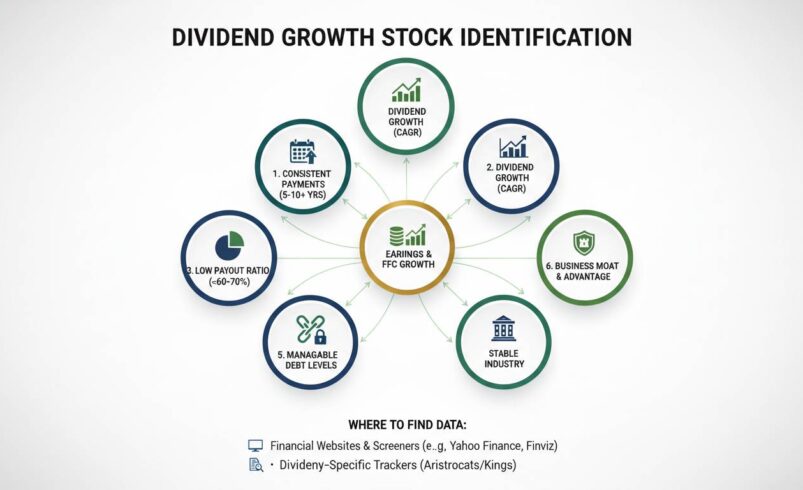
Understanding Dividend Growth Rate
Dividend growth rate measures the annualized rate at which a company has increased its dividend over a specific period, typically expressed as a compound annual growth rate (CAGR). This isn’t a simple average—CAGR smooths out the volatility to show the true consistent trajectory of dividend increases.
A company that paid $1.00 per share in 2014 and pays $2.10 per share today has grown its dividend at roughly 11% annually. That same company might have raised dividends by 3% one year and 18% the next, but the CAGR reveals the underlying trend. When evaluating dividend growth stocks, I look for companies maintaining a CAGR of at least 5-7% over 10-year periods. Anything below 5% signals sluggish payout growth that may not outpace inflation over time.
To calculate this yourself, divide the current annual dividend by the dividend paid ten years ago, raise the result to the power of 1/10, then subtract 1. For example, if a company paid $0.50 annually in 2014 and pays $1.10 today, the calculation yields approximately 9.2% CAGR. That’s a company worth deeper investigation.
Real-world example: Johnson & Johnson has increased its dividend for 62 consecutive years. Its 10-year dividend growth rate hovers around 6%, which is sustainable because it’s backed by earnings growth in the mid-single digits. The key insight here is that dividend growth must be financed by earnings growth—companies that raise dividends faster than earnings are heading toward trouble.
Payout Ratio: The Divide Between Sustainability and Disaster
The payout ratio divides the annual dividend payment by annual earnings per share (EPS), expressing what percentage of profits the company returns to shareholders. A 60% payout ratio means the company distributes 60% of earnings as dividends, retaining 40% for reinvestment, debt reduction, or cash reserves.
A healthy payout ratio for dividend growth investors should stay below 60% for most companies. Above 70%, the company has minimal flexibility to maintain dividend increases during earnings downturns. Above 85%, you’re looking at a dividend that’s essentially unsafe—any earnings dip forces either a cut or an unsustainable strain on cash flow.
This is where many retail investors get into trouble. They see a 6% yield and think they’ve found a winner, but that yield often exists because the stock has fallen due to earnings concerns—the payout ratio might be 110%, meaning the dividend exceeds earnings and is clearly unsustainable.
Consider AT&T versus Apple in recent years. AT&T’s yield frequently exceeded 7%, but its payout ratio exceeded 90% during periods of earnings pressure, forcing dividend cuts. Meanwhile, Apple pays a lower yield but maintains a payout ratio around 25-30%, leaving enormous room for continued dividend growth. The lower yield with sustainable growth beats the higher yield that’s likely to be cut.
I screen for companies where the payout ratio has remained below 65% consistently over the past decade, even as dividends grew. This dual requirement—high dividend growth plus moderate payout ratio—separates the dividend growers from the dividend cutters.
Years of Consecutive Dividend Increases
The dividend aristocrats list—companies in the S&P 500 that have increased dividends for at least 25 consecutive years—provides an excellent starting point for screening. There are roughly 70 dividend aristocrats. But I don’t stop there. The dividend kings, with 50+ consecutive years of increases, are even more selective—fewer than 20 companies hold this designation.
The consecutive years metric matters because it demonstrates management’s commitment through multiple economic cycles. Companies that cut dividends during the 2008 financial crisis or the 2020 pandemic weren’t aristocrats—they lost their streak. The current aristocrat and king lists represent companies that prioritized shareholder returns even when it would have been easier to preserve cash.
However, the streak shouldn’t be the only criterion. Some companies have increased dividends mechanically through share buybacks that artificially boost per-share metrics without genuine cash flow improvement. This is why the streak must be evaluated alongside earnings growth and payout ratio.
Looking at the 2024 dividend aristocrat list, companies like Procter & Gamble, Johnson & Johnson, and PepsiCo demonstrate the ideal combination: decades of consecutive increases, moderate payout ratios, and earnings growth that finances those increases. These aren’t exciting stocks, but they’re reliable holdings for a dividend growth portfolio.
Dividend Yield: Why Lower Is Often Better
A lower dividend yield often indicates a better dividend growth opportunity. This seems counterintuitive—wouldn’t you want the highest yield possible? Not when you’re building a dividend growth portfolio.
When a stock price falls, dividend yield rises. A 5% yield might reflect a 30% price decline rather than a generous payout. Meanwhile, a company like Microsoft, with a 0.7% yield, has raised its dividend by over 200% over the past decade. The total return from dividend growth plus price appreciation far exceeds what you’d get from a high-yield stock that’s stagnant or declining.
The sweet spot I target is companies with yields between 1.5% and 3.5% that also demonstrate high single-digit or double-digit dividend growth rates. This combination suggests the company is still in its growth phase—raising dividends aggressively while the yield remains reasonable. As the dividend grows, your yield on cost compounds dramatically.
Here’s the calculation: if you buy a stock at $100 with a 2% yield ($2 annual dividend) and the dividend grows at 10% annually, you’ll receive $5.16 in annual dividends after ten years. Your yield on cost is now 5.16%. The high-yield stock that never raised its dividend is still paying $2 on your original $100 investment.
Earnings Growth: The Foundation That Finances Dividends
Dividends are paid from earnings, not from stock prices or revenue. A company can maintain dividend payments for a year or two from cash reserves during an earnings downturn, but sustainable dividend growth requires earnings growth. This is the metric most amateur investors overlook.
I look for companies where earnings per share have grown at a CAGR of at least 5-7% over 10 years. The dividend growth rate should roughly match or slightly exceed earnings growth—if dividend growth consistently outpaces earnings growth, the payout ratio will eventually become unsustainable.
The relationship between earnings growth and dividend growth is the canary in the coal mine. When you see a company raising dividends at 12% annually but growing earnings at only 4%, that’s a warning sign. Either the payout ratio is climbing into dangerous territory, or the company is funding dividends from debt—both unsustainable scenarios.
Real example: Costco has grown its earnings per share at roughly 15% annually over the past decade while increasing its dividend by approximately 20% annually. This works because earnings growth leads—dividend growth follows, not the other way around. The company’s aggressive expansion and membership model generate earnings growth that comfortably finances the dividend increases.
Step-by-Step Screening Process
Let me walk through my actual screening workflow.
First, I use a stock screener—Morningstar, Finviz, or my broker’s built-in screening tools—to filter for companies with 10+ years of consecutive dividend increases. This instantly narrows the field to under 200 companies from thousands of publicly traded stocks.
Second, I filter for payout ratios below 60%. This eliminates companies that are paying out more than they can sustainably afford. The screener should show both the current payout ratio and the five-year average.
Third, I check the five-year dividend growth rate. I look for at least 5% annually, though 7-10% is preferable for younger dividend portfolios. This filters for companies still in growth mode rather than mature companies approaching dividend stagnation.
Fourth, I verify earnings growth. I want to see EPS growth that roughly matches or exceeds dividend growth over the same period. If dividends have grown faster than earnings for five years running, I’ll investigate carefully before adding the position.
Fifth, I analyze the sector and business model. Companies in stable sectors—consumer staples, utilities, healthcare, industrials—have stronger track records of sustained dividend growth than those in volatile sectors like technology or energy. This isn’t a hard rule, but it’s a useful starting filter.
Common Mistakes That Cost Dividend Investors
The most frequent mistake is chasing yield without evaluating sustainability. That 8% yield might look attractive, but if the payout ratio is 120% and earnings are declining, you’re not collecting income—you’re waiting for a cut. The stock price will decline as the market prices in the dividend reduction, and you’ll lose both income and principal.
Another error is ignoring the price-to-earnings ratio. A dividend growth stock trading at 40x earnings is priced for perfection—any disappointment in future earnings will hit the stock hard, potentially offsetting years of dividend income with capital losses. I prefer companies with P/E ratios in the 15-25 range, which provides a margin of safety.
Finally, many investors fail to diversify across sectors. A portfolio concentrated in one sector—financials in 2008, energy in 2015—will suffer devastating dividend cuts when that sector faces headwinds. The dividend aristocrat and king lists span multiple sectors specifically because dividend sustainability depends on business model resilience, not just financial metrics.
Building Your Dividend Growth Watchlist
The practical outcome of this screening process is a focused watchlist of 20-30 companies that meet all criteria. From there, I evaluate each company on business quality, competitive positioning, and whether the current valuation makes sense for building a position.
The companies that consistently appear on quality dividend growth screens include Procter & Gamble, which has raised dividends for 68 years; Microsoft, which has increased dividends for 21 consecutive years with a payout ratio under 30%; and NextEra Energy, a utility that’s grown dividends at over 10% annually while maintaining a reasonable payout ratio for its sector.
The key insight is that identifying dividend growth stocks isn’t about finding one metric—it’s about evaluating the relationship between dividend growth, earnings growth, and payout ratio over extended time periods. Do this analysis consistently, and you’ll build a portfolio that generates increasing income for decades.
What remains unresolved in dividend investing is whether the current era of high dividend growth rates can continue. With interest rates normalizing and valuations compressing for growth stocks, some dividend growth stocks may see their expansion slow. That’s not a reason to avoid the strategy—it’s a reason to be more selective about valuations and to expect more realistic 5-7% dividend growth rather than the 10%+ rates some companies delivered in the past decade.


