
Every serious investor needs to look under the hood before committing capital. The balance sheet is that hood—and unlike earnings reports that can be manipulated through accounting sleight of hand, the balance sheet offers a snapshot of what a company actually owns and owes at a specific moment. If you’re skipping this step, you’re buying a car without checking whether the engine still has all its parts. I’ve been analyzing balance sheets for over fifteen years, and the companies that have saved me from catastrophic losses are the ones where the numbers told a story that didn’t match the hype. Here’s how to read that story yourself.
What a Balance Sheet Actually Tells You
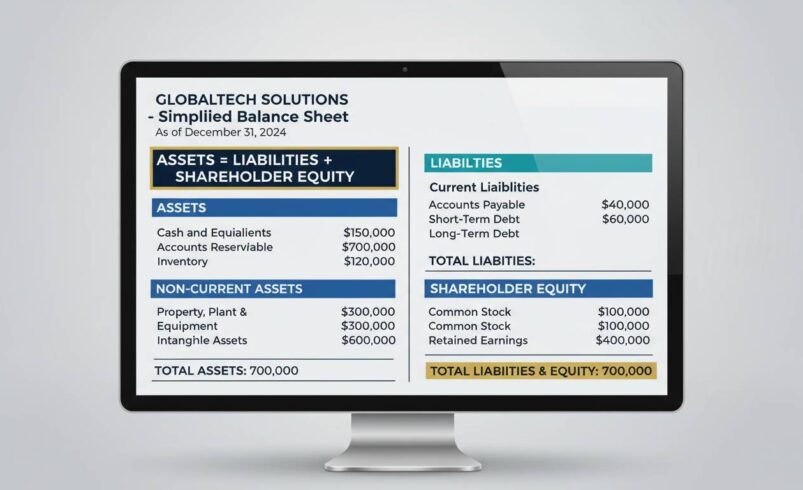
A balance sheet follows a deceptively simple formula: Assets equal Liabilities plus Shareholder Equity. This is the structural foundation that determines whether a company can survive a downturn, fund growth, or weather unexpected expenses. The date on the balance sheet matters enormously. Most companies report quarterly, so you’re looking at a snapshot that could be three months old. In fast-moving industries, that lag can hide deterioration that’s already begun.
Assets divide into two categories that demand different analytical approaches. Current assets are those expected to convert to cash within one year—inventory, accounts receivable, cash itself. Non-current assets include property, equipment, intangible assets like patents, and long-term investments. The ratio between these two categories reveals how flexible a company is when trouble hits. A company with mostly non-current assets can’t easily sell them to pay unexpected bills.
Liabilities work the same way. Current liabilities come due within twelve months—accounts payable, short-term debt, accrued expenses. Long-term liabilities extend beyond that horizon, typically bonds, pension obligations, and term loans. What you want to see is a company whose asset maturity profile comfortably exceeds its liability maturity profile. When that relationship inverts, solvency questions emerge.
Shareholder equity represents the residual claim—what’s left for owners after all debts are paid. It includes paid-in capital (what investors originally contributed), retained earnings (profits kept in the business), and treasury stock (shares the company has repurchased). This section often gets overlooked by beginners, but it contains critical information about how management has deployed capital over time.
The Financial Ratios That Actually Matter
Most investors get lost in the noise of dozens of ratios. You need to focus on five that consistently reveal the most about a company’s financial health.
Current Ratio divides current assets by current liabilities. A ratio above 1.0 means the company can cover its short-term obligations. Below 1.0 is a warning sign—though some industries, like grocery retail, operate comfortably below 1.0 because inventory turns over so quickly. Don’t apply this mechanically. Amazon’s current ratio has historically hovered around 1.0, yet the company generates enormous cash flow from operations. The ratio tells you something, but not everything.
Quick Ratio strips out inventory from current assets, giving you a stricter view of liquidity. If a company had to pay all its current liabilities today, could it do so without selling inventory? That’s what the quick ratio answers. A result above 0.8 is generally healthy. Below 0.5 warrants serious investigation.
Debt-to-Equity Ratio divides total liabilities by shareholder equity. This is where many growth investors get burned. I watched tech investors pile into companies with debt-to-equity ratios above 5.0 during the 2021 mania, convinced that growth justified any leverage. When interest rates rose, those equations collapsed. As a rough benchmark, I look for ratios below 1.0 for most companies, below 2.0 for capital-intensive businesses, and I’m extremely cautious above 3.0.
Here’s the counterintuitive point most articles won’t tell you: a zero-debt company isn’t necessarily healthy. Some companies have no debt because they’re not investing in growth, or because lenders refused to extend credit. What matters is not whether debt exists, but whether the company can service that debt comfortably. A modest debt load combined with strong cash flow often indicates that banks trust the business—a signal worth heeding.
Return on Equity (ROE) measures how effectively management uses shareholder capital. Calculate it by dividing net income by shareholder equity. An ROE above 15% generally indicates efficient capital deployment. Below 10% suggests either poor management, excessive debt, or an industry with structurally low returns. Be wary of extremely high ROE above 25%—this sometimes indicates excessive leverage rather than genuine operational excellence.
Working Capital is simply current assets minus current liabilities. Positive working capital means the company has a cushion for operations. Negative working capital isn’t automatically bad—retailers like Costco operate with negative working capital because they collect cash from customers before paying suppliers—but it requires understanding why.
Reading the Asset Section With Appropriate Skepticism
The asset side of the balance sheet requires you to ask quality questions, not just totals.
Accounts Receivable deserves careful attention. Rising receivables faster than revenue is a classic warning sign. It often means the company is stuffing channels—shipping product to distributors that hasn’t actually sold through to end customers. When you see revenue growing but cash flow declining, check the receivable trend. I’ve seen this pattern precede disaster at companies like Sunoptic Technologies, where channel stuffing inflated apparent growth before a massive restatement.
Inventory analysis varies by industry. For technology companies, aging inventory becomes obsolete quickly—a smartphone component worth $10 last year might be worth $2 this year. For consumer goods companies, inventory obsolescence matters less, but excess inventory still ties up capital and signals weak demand. The days inventory outstanding metric tells you how long inventory sits before selling. A rising trend without explanation is problematic.
Property, Plant, and Equipment appears at carrying value, which is original cost minus accumulated depreciation. This often bears little relationship to market value. A manufacturing company might own land purchased decades ago that’s now worth ten times its book value—a hidden asset not reflected in the numbers. Conversely, a company with old equipment might face massive capital expenditure needs soon that the balance sheet doesn’t reveal.
Intangible assets have grown to dominate modern balance sheets. Goodwill, patents, software, brand value—these appear as assets but are inherently subjective. When Microsoft acquired LinkedIn for $26.2 billion in 2016, the difference between the tangible assets acquired and the purchase price appeared as goodwill on its balance sheet. That goodwill stays until management writes it down, which happens when they admit the acquisition failed to deliver expected value. Watch for companies that have accumulated large goodwill through acquisitions, particularly when those acquisitions were made during boom markets.
Understanding Liabilities Without Panicking
Liabilities scare novice investors, but they’re not inherently bad. The question is always whether the company can meet its obligations.
Short-term debt requires scrutiny. If a company consistently rolls over short-term debt to avoid long-term obligations, that’s a red flag. The pattern suggests lenders are reluctant to extend longer terms—often because they see elevated risk. Look at the debt maturity schedule in the footnotes. If most debt comes due within twelve months, you’re looking at a refinancing risk.
Long-term debt interest coverage ratio matters more than the absolute amount. Divide operating income (EBIT) by interest expense to find this coverage. Below 2.0 means the company has little margin for error. A single bad year could threaten solvency. Above 5.0 provides comfortable cushion. This ratio told the story at Chesapeake Energy in 2015—the company had accumulated debt during the gas boom, and when energy prices collapsed, interest coverage evaporated, forcing bankruptcy.
Off-balance-sheet obligations lurk in the footnotes. Operating leases, purchase commitments, guarantees—these don’t appear as liabilities on the face of the balance sheet but can represent significant obligations. Always read the footnotes. They contain information that management would prefer you not notice.
One honest admission: I frequently disagree with the conventional wisdom on debt levels. Most personal finance advice says to avoid debt entirely, but that’s inappropriate for businesses. The question isn’t debt versus no debt—it’s whether the return on borrowed capital exceeds the cost of that capital. A company borrowing at 5% to fund a project returning 15% creates value for shareholders. The same company borrowing at 12% to fund a project returning 8% destroys value. Always evaluate debt in context of return, not just the balance.
What Shareholder Equity Reveals About Management
The equity section tells you how the company has treated its owners over time, which is often a better indicator of management quality than any earnings report.
Retained earnings accumulate all profits since inception minus dividends paid. A consistently rising retained earnings line indicates a company that has generated genuine earnings over time. A stagnant or declining line despite reported profits means those profits went somewhere—usually to fund acquisitions that didn’t work, or to cover operating losses. When retained earnings diverge significantly from net income over extended periods, investigate why.
Treasury stock represents shares the company has bought back. Buybacks aren’t automatically good. A company buying back stock at $50 per share when the intrinsic value is $30 per share destroys shareholder value. A company buying back stock at $30 when intrinsic value is $50 creates it. The timing matters enormously. Many management teams buy back stock during booms when prices are highest, then stop when prices decline—the opposite of intelligent capital allocation.
Book value per share divides total equity by shares outstanding. Comparing this to the stock price gives you the price-to-book ratio. Value investors like Warren Buffett have historically sought companies trading below book value, though such opportunities have become rare in modern markets. A price-to-book below 1.0 means the market values the company at less than the accounting value of its assets—a potential bargain or a value trap, depending on why the discount exists.
Red Flags That Should Make You Walk Away
After fifteen years, I’ve developed a checklist of patterns that have saved me from significant losses. These aren’t absolute rules, but they demand explanation before I’d consider owning a stock.
Diverging trends between cash flow and net income over multiple years signals accounting manipulation or a deteriorating business. Real profits eventually convert to cash. If they don’t, something is wrong—either the earnings are fictional, or the company is investing heavily in ways that may never pay off.
Sudden increases in goodwill following acquisitions should concern you. Management teams often pay premium prices during optimism. When those acquisitions fail to deliver, goodwill gets written down, crushing equity. The footnotes reveal what acquired companies are underperforming.
Declining asset quality shows up in several ways. Longer receivable collection periods, rising inventory relative to sales, or equipment that isn’t being maintained. These patterns often precede earnings problems because they’re leading indicators of operational deterioration.
Executive selling matters more than most investors realize. When insiders sell heavily, particularly through open-market transactions rather than pre-planned programs, pay attention. CEOs know their companies better than anyone. Consistent selling, especially after lock-up periods expire following offerings, has preceded many blow-ups.
Negative equity isn’t always fatal—many profitable companies have negative equity because of aggressive buybacks or dividend policies combined with stock-based compensation. But it’s worth understanding why. If negative equity results from accumulated losses rather than shareholder returns, that’s a fundamentally different situation.
A Practical Framework for Your Decision
Before buying any stock, work through this sequence. First, obtain the most recent quarterly balance sheet from the company’s investor relations page or the SEC’s EDGAR database. Second, calculate the five key ratios: current ratio, quick ratio, debt-to-equity, ROE, and working capital. Compare these to industry peers—the right number for a bank differs completely from the right number for a software company. Third, read the debt footnotes to understand maturity schedules and contingent obligations. Fourth, examine the equity section to see what management has done with shareholder capital over the past five years. Fifth, check for the red flags: diverging cash flow, rising goodwill, declining asset quality, insider selling, or negative equity without clear explanation.
If something doesn’t make sense, dig deeper before committing capital. The extra hours of research have saved me from far more expensive mistakes.
Common Questions About Balance Sheet Analysis
What’s a good debt-to-equity ratio? It depends entirely on the industry. Banks typically operate with ratios above 10 because their assets (loans) generate returns exceeding their cost of debt. Technology companies with little debt often have ratios below 0.5. The key is comparing to industry peers and assessing whether debt load is manageable given the company’s cash flow.
Which ratio is most important for assessing liquidity? The quick ratio is more stringent than the current ratio because it excludes inventory, which may not be easily convertible to cash. For most non-retail businesses, a quick ratio above 1.0 indicates solid short-term health.
How do I know if a balance sheet is healthy? Look for consistency across multiple periods. A healthy company shows stable or improving ratios, manageable debt levels relative to peers, adequate liquidity to cover short-term obligations, and equity that grows over time. Sudden changes, particularly improvements that seem too good, warrant skepticism.
Should I avoid companies with any debt? Absolutely not. Many excellent companies leverage debt to fund growth that exceeds shareholder returns. Evaluate debt in context of interest coverage, return on assets, and the company’s ability to refinance. The absence of debt can indicate missed opportunities or risk aversion that limits growth.
The balance sheet won’t tell you everything about a company—it won’t reveal whether a competitor is about to release a disruptive product, or whether consumer tastes are shifting. But it will tell you whether a company has the financial foundation to survive challenges and capitalize on opportunities. That’s information you cannot afford to skip before making an investment decision.


