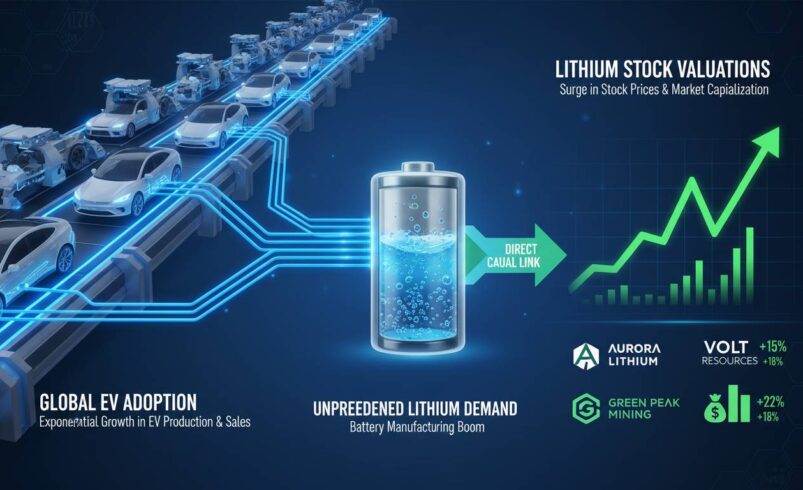
The relationship between electric vehicle adoption and lithium stock valuations is the dominant force shaping one of the most volatile commodity markets in recent memory. When global EV sales surged 35% in 2022, lithium prices peaked at nearly $80,000 per metric ton, and producers like Albemarle and SQM saw their stock prices more than double. When Chinese EV growth slowed in late 2023, the same stocks lost half their value within months. This isn’t just correlation. It’s direct causation with a velocity that surprises even seasoned commodity traders.
Understanding this dynamic matters because lithium represents the single largest cost component in EV batteries, and supply cannot respond quickly to demand shifts. The market has learned — often painfully — that EV adoption trajectories translate almost immediately into lithium equity valuations. What follows is a breakdown of how this mechanism works, which stocks respond most directly, and where the analysis gets more complicated than the headline relationship suggests.
The Fundamental Demand Mechanism
Lithium sits at the center of the EV supply chain because it is the key input for lithium-ion battery cathodes, which determine range, charging speed, and overall battery performance. Global demand for lithium has more than quadrupled since 2018, and roughly 80% of that growth comes from EV production rather than traditional applications like ceramics, glass, or lubricants.
The mechanics are straightforward: every lithium-ion battery pack contains between 8 and 15 kilograms of lithium equivalent, depending on chemistry and vehicle size. As automakers scale EV production, they lock in lithium supply years ahead through offtake agreements, and this forward demand signals to producers that capacity expansion is warranted. The problem is that lithium mining projects take three to seven years from discovery to production, while EV manufacturing can scale in 18 to 24 months. This structural mismatch creates the boom-bust dynamics that have defined the lithium market since 2020.
China remains the dominant force in this equation, accounting for roughly 75% of global lithium processing capacity and approximately 60% of EV battery production. When Chinese EV sales accelerate, the ripple effect reaches lithium producers worldwide within a single quarter. This concentration means that EV adoption data from China has become a leading indicator that lithium investors watch closely.
Historical Correlation: What the Data Shows
The correlation between EV adoption metrics and lithium equity valuations is measurable and significant, though it has evolved as the market matured. Between 2020 and 2022, the relationship was almost linear. Global EV sales grew from 3.2 million units in 2020 to 10.6 million in 2022, and Albemarle’s stock price rose from approximately $60 to over $230 during the same period. SQM’s trajectory was similar, climbing from $30 to over $100 before its 2022 peak.
The interesting deviation appeared in 2023. Despite global EV sales continuing to grow, reaching approximately 14 million units worldwide, lithium prices collapsed by more than 80% from their peak, and equity valuations followed. Albemarle’s stock fell below $90 by December 2023, representing a 60% decline from its 2022 high despite steady demand growth. This disconnect revealed something important: the market had been pricing in supply expansion that never materialized as projected, and when it became clear that lithium supply would outstrip demand by 2024, the correction was severe.
The data from 2023 onward demonstrates that the relationship between EV adoption and lithium stocks is mediated by supply expectations. Pure demand growth without supply constraints does not support the same valuation multiples. This nuance is critical for investors — the headline EV sales number matters, but what matters more is the gap between demand growth and supply growth trajectories.
Major Lithium Producers and Their Equity Sensitivities
Not all lithium stocks respond equally to EV adoption trends. The degree of correlation depends on several factors: production scale, geographic diversification, product mix, and whether the company is vertically integrated into battery materials.
Albemarle Corporation remains the largest global lithium producer by market cap, with operations spanning Australia, Chile, and the United States. The company supplies roughly 15% of global lithium production and has historically demonstrated the strongest correlation with EV adoption sentiment. Its 2022 valuation boom and 2023 decline both exceeded the broader lithium equity index, making it a high-beta play on EV demand. Albemarle’s sensitivity makes it attractive for investors who want direct exposure to the EV growth thesis, but it also means sharper drawdowns when the narrative shifts.
Sociedad Química y Minera de Chile operates the world’s largest lithium brine operation in the Atacama salt flat and has aggressively expanded its hydroxide production capacity. SQM’s valuation has historically tracked lithium prices more closely than Albemarle’s, partly because its cost structure is lower and partly because it has more direct exposure to Chinese battery manufacturers through long-term contracts. In 2022, SQM reported record profits exceeding $3.8 billion, driven by lithium prices that averaged nearly three times 2021 levels. The company’s stock response to EV demand signals is immediate and pronounced.
Livent Corporation represents a different profile — a smaller, more specialized producer focused on battery-grade lithium hydroxide for premium applications. Livent’s exposure to the EV market is significant but not exclusive, as it also serves the aerospace and pharmaceutical industries. This diversification provides some downside protection, but it also means Livent’s correlation with EV adoption is less pronounced than its larger competitors. For investors seeking lithium exposure with slightly lower volatility, this intermediate profile has value.
Beyond these established producers, junior miners and explorers like Lithium Americas and Piedmont Lithium offer even higher-beta exposure. These companies are years from meaningful production, so their valuations respond more to sentiment and funding environment than to current EV sales data. They can outperform dramatically during bull markets — Lithium Americas gained over 200% in the first half of 2022 — but they also face dilution risk and execution risk that established producers do not. The choice between established producers and junior miners ultimately reflects an investor’s conviction in the EV adoption timeline and their tolerance for volatility.
The Battery Manufacturer Angle
A often overlooked dimension of this analysis is that lithium stock valuations are increasingly influenced by battery manufacturer dynamics, not just mining producers. CATL, the world’s largest battery manufacturer, procures enormous volumes of lithium and has begun vertical integration into mining. When CATL announces capacity expansions or secures new offtake agreements, it signals future lithium demand that flows through to producer valuations.
Similarly, Tesla’s influence on the lithium market deserves specific attention. Beyond being the world’s largest EV producer, Tesla has directly contracted lithium supply from multiple producers, including an agreement with Piedmont Lithium for spodumene concentrate. Tesla’s production forecasts, delivered quarterly during earnings calls, have moved lithium producer stocks within hours of release. The company’s 2023 investor day explicitly emphasized its goal of reducing lithium costs by 50%, which created immediate selling pressure across the lithium equity universe.
This interconnection means that lithium stock analysis cannot focus solely on mining data. Understanding individual automaker and battery manufacturer strategies has become essential to anticipating demand signals before they appear in aggregate statistics.
Counterintuitive Dynamics: Where the Simple Narrative Breaks
The conventional wisdom — that EV growth directly drives lithium stock prices — holds true in broad strokes but contains several important complications that sophisticated investors must acknowledge.
First, lithium prices and EV adoption have already diverged significantly. In 2024, global EV sales continued growing at approximately 15% year-over-year, yet lithium prices remained near three-year lows below $15,000 per ton. This persistent weakness reflects the supply response that finally materialized after years of development: new Australian spodumene projects, expanded Chilean brine operations, and emerging African hard-rock mines have collectively created oversupply conditions that will take years to absorb. The implication is stark — EV adoption growth alone is no longer sufficient to support lithium price appreciation. Supply discipline from producers and demand from emerging applications beyond EVs will determine whether the correlation reasserts itself.
Second, the market has begun pricing in solid-state battery technology as a potential disruptive force, even though commercial deployment remains years away. Toyota has repeatedly announced timelines for solid-state battery introduction, and while analysts remain skeptical of those targets, the narrative has created overhang on lithium-exposed equities. If solid-state batteries require less lithium per vehicle, current projections suggest reductions of 20% to 40%, the long-term demand growth curve for the commodity flattens. This represents a genuine structural risk that the EV adoption correlation alone does not capture.
Third, geographic concentration creates policy risk independent of demand fundamentals. More than 80% of global lithium processing capacity resides in China, and U.S. policy initiatives like the Inflation Reduction Act have created incentives for domestic processing that may eventually shift supply chains. The timing and magnitude of this shift remain highly uncertain, but it introduces a variable that pure EV adoption analysis cannot capture.
These complications do not invalidate the EV-lithium correlation. Rather, they establish the boundaries within which that correlation operates. Investors who understand these nuances will avoid the trap of assuming that any EV sales increase automatically translates to lithium stock appreciation — a trap that cost many retail investors heavily in 2023.
Future Outlook: Projections and Analyst Perspectives
Looking ahead, the relationship between EV adoption and lithium stocks will continue evolving as the market matures. Most analysts project global EV sales to reach 20 to 25 million units by 2025, representing roughly 25% to 30% of total passenger vehicle sales. This growth trajectory should support lithium demand of approximately 1.5 to 1.8 million metric tons by 2025, compared to roughly 1 million metric tons in 2023.
Whether this demand growth translates to higher lithium prices and equity valuations depends critically on supply discipline. Several major producers, including Albemarle, have announced production cuts in response to weak pricing. Approximately 50,000 to 80,000 metric tons of lithium equivalent has been removed from 2024 and 2025 production guidance. If these cuts restore supply-demand balance faster than expected, price recovery could coincide with continued EV adoption growth, creating a favorable environment for lithium equities.
The wildcard remains China’s policy environment. Beijing’s subsidies for EV purchases have been a primary driver of adoption growth, and any reduction in those incentives would immediately affect global lithium demand projections. Conversely, if China implements stronger-than-expected stimulus or accelerates its transition away from internal combustion vehicles, the supply-demand balance could shift faster than current forecasts assume.
For investors considering lithium exposure, the current environment presents a nuanced picture. Prices have declined significantly from 2022 peaks, potentially creating entry points for those who believe EV adoption will continue accelerating. The correlation between adoption rates and valuations remains structurally intact, even if it has temporarily weakened. But the market now prices in supply growth that did not exist three years ago, meaning that future appreciation will require not just demand growth but actual supply constraints.
What Remains Unresolved
The honest answer about EV adoption rates and lithium stock valuations is that the correlation is real but incompletely understood by the market. We know that EV demand drives lithium consumption. We know that lithium consumption influences producer economics. What we understand less clearly is how the equity market prices this relationship at any given moment, particularly during periods of supply disruption or technological uncertainty.
The question that should keep investors awake is whether the lithium market is currently in a structural oversupply phase that will take years to resolve, or whether the recent price collapse has created a mispricing opportunity that will correct as supply discipline takes hold. The answer will determine whether the historical correlation reasserts itself or whether the relationship fundamentally changes as the industry matures.
Either way, watching EV adoption data remains essential for anyone holding or considering lithium equities. The correlation has not disappeared. It has simply become more conditional — and more interesting.