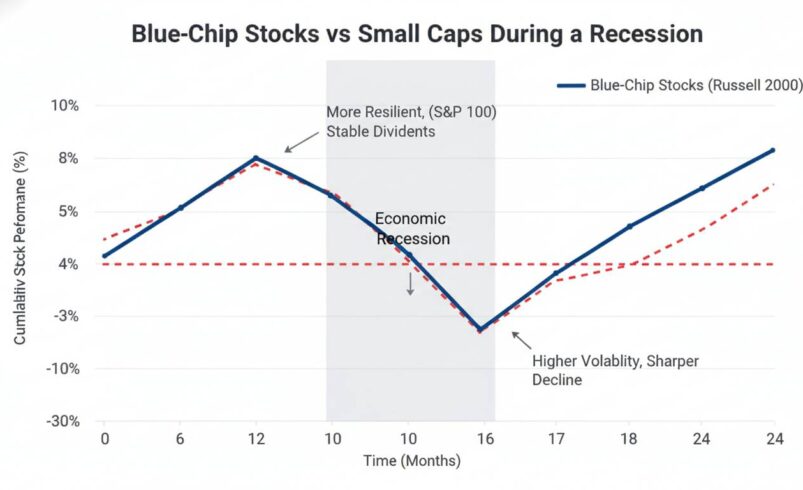
The conventional wisdom among retail investors holds that large-cap blue-chip stocks are the safe haven during economic downturns. That’s largely true—but the reality is more nuanced than most investment guides admit. Blue-chip stocks do tend to outperform small-cap equities during recessions, but the margin of outperformance varies dramatically depending on the specific economic contraction, its underlying causes, and how quickly monetary and fiscal policymakers respond. Understanding exactly when, why, and by how much blue-chip stocks outperform small caps requires looking at historical data without the rose-colored glasses that many financial publications wear.
This analysis examines the historical performance of blue-chip stocks versus small-cap stocks during major recessions since 1990, unpacks the structural reasons for this performance gap, and offers a framework for thinking about portfolio allocation during economic uncertainty. I’ll also address where the conventional wisdom oversimplifies things—because there are legitimate reasons to maintain some small-cap exposure even when the macro environment looks grim.
Defining the two categories
Before examining recession performance, we need clear definitions, because the boundaries between “blue-chip” and “small-cap” can blur depending on market conditions.
Blue-chip stocks typically refer to large, established companies with market capitalizations exceeding $10 billion, consistently profitable operations, dividend payment histories spanning decades, and balance sheets strong enough to survive prolonged revenue declines. Think companies like Johnson & Johnson, Procter & Gamble, Microsoft, and Berkshire Hathaway. These are the names your grandparents recognized, and for good reason—they’ve survived multiple economic cycles.
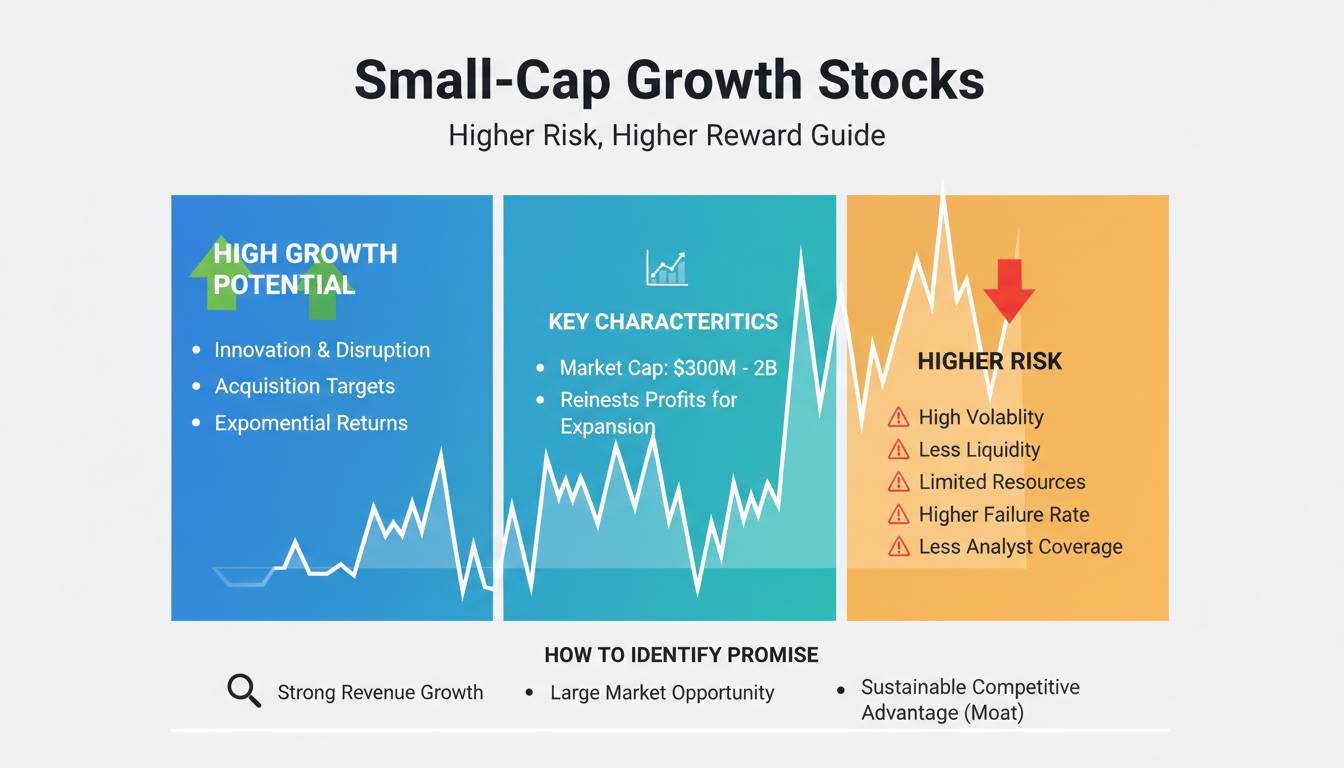
Small-cap stocks generally include companies with market capitalizations between $300 million and $2 billion. Many are still in growth phases, serving niche markets, or operating with thinner margins. During recessions, these companies often face liquidity crunches, tighter credit conditions, and demand destruction that hits their revenues harder than that of companies with diversified customer bases and pricing power.
The Russell 2000 Index is the standard benchmark for small-cap performance, while the S&P 500—dominated by large-cap names—tracks the blue-chip universe. Comparing these indices during recessionary periods gives us the data we need.
The 2008 financial crisis
The Global Financial Crisis provides the most dramatic evidence for blue-chip outperformance during recessions. Between October 2007 (the market peak) and March 2009 (the bottom), the S&P 500 fell 57%, a devastating decline that wiped out years of gains. The Russell 2000, however, fell 59%—worse, but not enormously so during that initial crash phase.
Where the gap truly opened was in the recovery. From March 2009 through December 2009, the S&P 500 surged 68%, reclaiming much of its lost ground in what became one of the fastest bear-market recoveries in history. The Russell 2000 gained only 52% during that same period. By the end of 2009, the gap between large and small caps had widened meaningfully.
The pattern continued for years. By December 2013—five years after the crisis low—the S&P 500 had returned 169% from its bottom, while the Russell 2000 had returned just 155%. The gap wasn’t massive, but it was consistent.
What drove this divergence? Banks and financial institutions, heavily represented in large-cap indices, received government bailouts and benefited from unprecedented Federal Reserve intervention. Small banks, by contrast, faced a credit crunch that choked off their funding. Meanwhile, large consumer-facing companies like Walmart and Costco benefited from consumers trading down, while small retailers struggled with collapsing consumer spending and tighter credit.
The financial crisis also exposed the fragility of small-cap balance sheets. Many small companies had relied on commercial paper markets and revolving credit facilities that simply disappeared when credit seized up. Large-cap companies, with their investment-grade credit ratings and established banking relationships, could access capital even when it was expensive.
The 2020 pandemic recession
The COVID-19 recession of 2020 offers a fascinating counterpoint that challenges the “blue-chips win” narrative. This was the fastest recession in U.S. history—lasting just two months—and the recovery was equally swift.
The S&P 500 fell 34% from February 2020 to March 2020. The Russell 2000 fell 40%. Blue-chip stocks clearly outperformed during the crash phase. However, the recovery told a different story. By August 2020, the S&P 500 had recovered all its losses and hit new highs. The Russell 2000 didn’t recover to its pre-pandemic level until November 2020.
What made the 2020 case interesting is that the sectors driving large-cap performance were heavily weighted toward technology companies—Apple, Microsoft, Amazon, Alphabet—that benefited directly from the pandemic’s shift to remote work and digital commerce. These aren’t your grandfather’s blue chips. They are growth companies trading at large-cap valuations, and they benefited from a specific economic shock that favored digital business models.
Small caps, particularly in sectors like hospitality, retail, and energy, faced existential threats. Airlines, cruise companies, and hotel chains—many small-cap or mid-cap names—saw revenues collapse overnight. Energy companies faced the additional shock of negative oil prices in April 2020.
The lesson: even within the “blue-chip” category, sector composition matters enormously. A blue-chip portfolio heavy in energy and industrials would have performed very differently from one weighted toward technology and healthcare.
The 2022 slowdown
The 2022 market environment introduced complications that don’t fit neatly into the standard recession narrative. While the official National Bureau of Economic Research designation came later, markets treated 2022 as a recessionary period, with the S&P 500 falling 19% and the Russell 2000 falling 21%.
The gap was smaller than in previous recessions. Part of this reflects the unusual nature of the 2022 downturn—driven by inflation and aggressive Federal Reserve tightening rather than a financial crisis or demand shock. In an environment where interest rates are rising rapidly, both large and small caps face headwinds, but small caps, which rely more heavily on debt financing, face proportionally greater pressure.
What made 2022 particularly challenging for the blue-chip narrative was that many traditional safe-haven blue chips—utilities, consumer staples, healthcare—actually underperformed. These sectors, which typically hold up better during recessions, got caught in the broader sell-off as investors dumped everything except cash. Meanwhile, some small-cap growth names, particularly in energy and defense, outperformed.
This recession illustrates an important point: the blue-chip advantage isn’t automatic. It depends on the nature of the economic shock and the policy response.
Why blue-chips generally outperform
The structural advantages that blue-chip stocks enjoy during recessions come down to four factors: balance sheet strength, pricing power, dividend reliability, and access to capital.
Balance sheet strength means having sufficient cash reserves and low enough debt to survive years of depressed revenue. When consumers stop spending and credit tightens, companies with $10 billion in cash and minimal debt can continue operations, maintain R&D spending, and position themselves for recovery. Small companies often lack this cushion. During the 2008 crisis, hundreds of small and mid-size banks failed because they couldn’t survive the combination of loan losses and deposit outflows.
Pricing power allows blue-chip companies to raise prices during inflationary periods without losing customers. Companies like Coca-Cola, Procter & Gamble, and Church & Dwight have brand strength that lets them pass input cost increases to consumers. Small companies competing on price often cannot, meaning margins compress more severely during downturns.
Dividend reliability matters because during recessions, investors often rotate toward stocks that provide income regardless of market conditions. Blue-chip dividend aristocrats—companies that have increased dividends for at least 25 consecutive years—become particularly attractive when bond yields are volatile. This demand supports blue-chip prices even when earnings are declining.
Access to capital is perhaps the most important factor. When credit markets freeze, large companies can issue commercial paper, tap credit lines, or sell stock. Small companies often have no such options. During the 2008 crisis, the commercial paper market—a critical funding source for large corporations—seized up briefly, but the Federal Reserve intervened to restore functionality. No such rescue came for small companies reliant on regional bank lending.
Where the conventional wisdom gets it wrong
Here’s where I want to push back on the standard investment narrative: the case for blue-chip supremacy during recessions is often overstated, and there are legitimate reasons to maintain small-cap exposure even when the economic outlook is bleak.
First, the historical outperformance margin is smaller than most people assume. Looking at recessions since 1990, the difference in peak-to-trough declines between the S&P 500 and Russell 2000 has typically been 3-8 percentage points. That’s meaningful, but it’s not a chasm. Small caps don’t become worthless during recessions; they simply underperform.
Second, the recovery phase often favors small caps. After the initial panic subsides and markets stabilize, small caps frequently lead the next bull market. The Russell 2000 outperformed the S&P 500 in the years following both the 2002 and 2009 bottoms. Investors who sold small caps at the bottom missed significant subsequent gains.
Third, valuation matters. When small caps fall harder, their valuations often become compelling relative to large caps. The price-to-earnings ratio spread between small and large caps tends to compress after recessions as investors reward beaten-down small names. This creates opportunities for patient investors.
Fourth, sector composition matters more than market cap. A portfolio of high-quality small-cap companies in defensive sectors may outperform a portfolio of large-cap companies in cyclical sectors during a recession. The 2022 experience demonstrated this clearly.
Investment strategy during recessions
Given this data, what should investors actually do? The answer depends on your time horizon, risk tolerance, and conviction about the severity of the impending downturn.
For short-term protection, blue-chip exposure makes sense. If you need to preserve capital over the next 12-24 months and can’t afford significant portfolio declines, increasing allocation toward dividend-paying large-cap stocks with strong balance sheets reduces volatility and downside risk. Companies like Johnson & Johnson, Abbott Laboratories, and Microsoft fit this profile.
For long-term investors, the case for complete small-cap avoidance is weaker. History suggests that small caps recover strongly after recessions, and valuations at market bottoms often create multi-year opportunities. Rather than exiting small caps entirely, consider shifting toward higher-quality small-cap names—companies with positive cash flow, manageable debt, and business models that can survive economic stress.
A balanced approach acknowledges that timing recessions perfectly is essentially impossible. Maintaining some small-cap exposure—even reduced exposure—ensures you participate in the recovery when it comes. The investors who suffered most during previous recessions weren’t those who held some small caps; they were those who sold everything at the bottom and waited for confirmation that the rally had begun, missing all the gains.
Portfolio allocation framework
Rather than offering a one-size-fits-all recommendation, here’s a framework for thinking about allocation:
If you believe a severe recession is imminent—something resembling 2008—increase blue-chip allocation to 60-70% of equity exposure, reduce small caps to 20-30%, and hold 10% in cash or short-term Treasuries. Focus on defensive sectors: healthcare, consumer staples, utilities. These sectors historically hold up best during severe downturns.
If you expect a mild recession—something resembling 1990-1991 or 2022—a 50-50 split between large and small caps makes more sense. The performance gap will be narrower, and small caps won’t face the same liquidity pressures.
If you’re uncertain about recession timing or severity, maintain a core allocation to blue-chip dividend stocks (40-50%) while keeping smaller positions in high-quality small caps (30-40%) and remaining flexible to add to either side based on market conditions.
What about 2025 and beyond?
As of early 2025, the economic picture remains uncertain. The Federal Reserve has begun easing interest rates after the aggressive tightening cycle of 2022-2023, but inflation remains above target and the labor market shows signs of cooling. Several leading indicators suggest elevated recession risk, though the economy continues to expand.
If a recession arrives, the playbook from previous cycles likely applies: blue-chip stocks will probably outperform during the initial downturn, but the margin may be narrower than historical averages. Why? Because large-cap indices now include many high-growth technology companies whose valuations depend on continued expansion rather than defensive stability. Apple and Microsoft may be large-cap, but they’re not your grandfather’s blue chips.
Small caps, meanwhile, trade at valuations relative to large caps near multi-decade lows. If a recession is mild and short, this valuation gap could close quickly, benefiting small-cap investors. If credit conditions tighten significantly, small caps could face another challenging period.
The honest answer is that no one knows with certainty how the next recession will play out. What the historical data clearly shows is that blue-chip stocks provide better downside protection during severe downturns, but that protection comes at a cost: reduced upside during recoveries. Smart investors position for both scenarios rather than betting on a single outcome.
Important Disclaimer: This article is for informational purposes only and does not constitute financial advice. Investment decisions should be made in consultation with a qualified financial advisor who can assess your individual circumstances, risk tolerance, and investment objectives. Past performance does not guarantee future results, and historical recession patterns may not repeat in future economic cycles.