The search for undervalued stocks isn’t about finding a secret formula—it’s about understanding that markets are inefficient, emotional, and frequently wrong. I’ve spent over a decade analyzing equities across bull markets, bear markets, and the grinding sideways periods that test every investor’s patience. What I’ve learned is this: the techniques that work when everyone is optimistic are radically different from those that work when fear dominates. The investors who consistently find hidden gems aren’t those who follow one rigid method. They’re the ones who understand how valuation signals shift depending on where we are in the cycle—and they have the intellectual honesty to admit when their favorite metric has stopped working.
This guide covers seven concrete methods for identifying undervalued stocks, explains how each performs differently across market cycles, and names the specific mistakes that destroy more portfolios than any bad stock pick ever will. I’ll also point you toward the tools that make this practical, not theoretical.
What “Undervalued” Actually Means
Before diving into methods, we need clarity on the concept itself, because most investors use “undervalued” as a vague compliment when they really mean “seems cheap.” That’s not enough.
A stock is undervalued when its market price sits below its intrinsic value—the present value of all future cash flows the business will generate, discounted appropriately. The gap between price and intrinsic value is your margin of safety, a concept popularized by Benjamin Graham and refined by Warren Buffett. That margin exists because we estimate intrinsic value using imperfect information and flawed models. The bigger the gap, the more room for error you afford yourself.
Why do stocks become undervalued in the first place? Several mechanisms create these opportunities. Market overreaction to short-term problems is the most common—earnings misses, management changes, or sector-wide selloffs that treat temporary setbacks as permanent impairments. Structural neglect also plays a role. Companies in unglamorous industries, without analyst coverage, or operating in markets Wall Street considers “boring” frequently trade at discounts to their fundamentals. And then there’s the cycle itself: during bear markets, good companies get punished alongside bad ones simply because the market has adopted a risk-off posture. This is where patient value investors make their best gains.
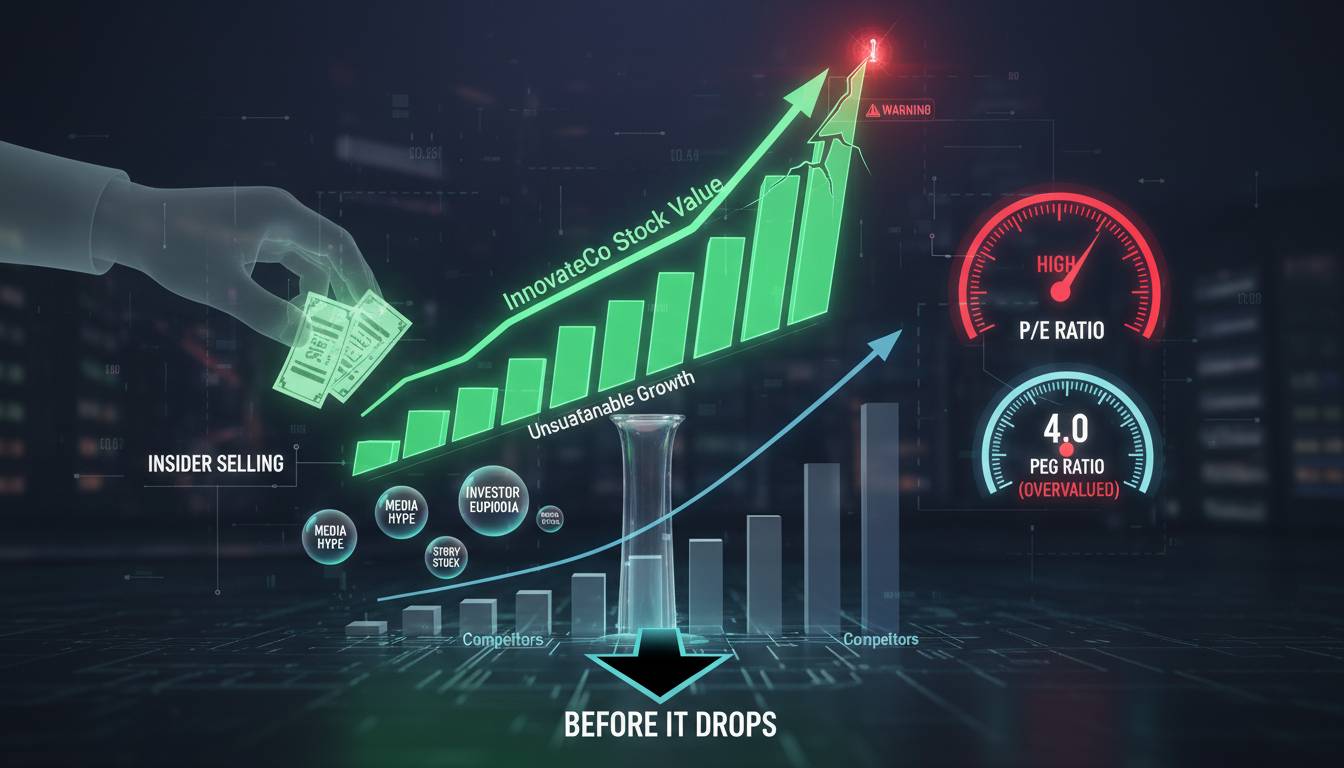
The key insight is that “undervalued” isn’t a static label. A stock trading at a P/E of 12 might be dramatically overvalued if earnings are declining 20% annually, while a stock at a P/E of 25 could be genuinely undervalued if earnings are growing at 30% and the multiple will compress to reasonable levels within two years. Context determines everything.
Price-to-Earnings Ratio: The Starting Point Everyone Gets Wrong
The P/E ratio is the most widely cited valuation metric, and that’s precisely why most investors use it incorrectly. They see a low number and assume they’ve found a bargain. The reality is more nuanced.
A P/E ratio of 12 could represent a world-class business at a fair price, or it could represent a dying business whose earnings are about to collapse. The number in isolation tells you almost nothing. What matters is the relationship between the P/E and the company’s growth rate, profit margins, return on equity, and competitive position.
To use P/E effectively, compare it to the company’s historical range, to sector peers, and—most importantly—to the expected earnings growth rate. A company growing earnings at 15% annually that trades at a P/E of 20 is far more likely to be undervalued than a stagnant company at a P/E of 12, even though the latter looks cheaper on the surface.
One practical application: screen for companies with P/E ratios below their five-year average while earnings per share have been consistently positive. This filters for businesses the market has penalized recently but whose fundamental earnings power remains intact. You’ll find quality companies experiencing temporary setbacks—exactly the kind that recover.
The limitation most people ignore: P/E fails completely for unprofitable companies, tech stocks with heavy investment cycles, and financial institutions where earnings can be manipulated through accounting choices. If you’re restricting yourself to P/E alone, you’re ignoring entire sectors where value opportunities are most abundant.
Price-to-Book Ratio: The Metric Value Investors Actually Prefer
If P/E is the most popular valuation metric, price-to-book is the one serious value investors return to when they want real downside protection. Book value represents what would remain if the company liquidated all assets and paid off all liabilities. A stock trading below book value theoretically offers a margin of safety—you’re paying less than what the company’s hard assets are worth, regardless of what happens to earnings.
This is particularly powerful in capital-intensive industries: banks, insurance companies, industrial manufacturers, and real estate investment trusts. In these sectors, the asset base is visible, measurable, and often saleable. When the market irrationally discounts these businesses, you’re buying assets at a discount to their real worth.
The practical screen: look for P/B ratios below 1.5 in sectors where assets are genuinely valuable, then verify the assets aren’t deteriorating. A mining company with a P/B of 0.8 might look cheap, but if copper prices have collapsed and the mining rights are underwater, that book value is fictional. An insurance company with a P/B of 1.0, by contrast, is holding a bond portfolio you can value fairly accurately.
Here’s the counterintuitive point most articles won’t tell you: P/B has become less useful over the past two decades as intangible assets—software, brand value, intellectual property—have come to dominate corporate balance sheets. A software company with virtually no tangible assets can be worth 10x book while a manufacturer with massive tangible assets trades at book. You need to understand what type of company you’re analyzing before applying this metric.
PEG Ratio: Adding Growth to the Equation
The PEG ratio corrects for P/E’s blind spot: it considers growth. The formula is simple—divide the P/E ratio by the expected earnings growth rate (expressed as a whole number). A stock with a P/E of 20 growing at 20% annually has a PEG of 1.0. A stock with a P/E of 20 growing at 10% has a PEG of 2.0.
Conventional wisdom holds that a PEG below 1.0 indicates undervaluation, while anything above 2.0 suggests overvaluation. This is a useful starting framework, but it has serious limitations.
First, growth rates are estimates. Analysts frequently project 15% annual growth for five years when the actual figure turns out to be 5%. A low PEG based on aggressive growth assumptions is not a bargain—it’s a trap. Second, the PEG ratio ignores the quality of that growth. Revenue growth from acquisitions looks different from organic growth. Growth in a declining industry differs from growth in an expanding market.
What works better in practice: use PEG as a ranking tool rather than a decision rule. Compare companies within the same sector, using consensus growth estimates, and focus on those where the PEG appears materially below their historical range or below comparable peers. Then investigate why the market is discounting that growth. Often, the explanation reveals whether you’ve found a genuine opportunity or a value trap.
Discounted Cash Flow Analysis: The Gold Standard That’s Often Misused
Discounted cash flow (DCF) is the most theoretically sound valuation method: estimate future cash flows, discount them back to present value, and you get intrinsic value. If the market price is below that number, the stock is undervalued.
The problem is that DCF models are only as good as their inputs, and estimating future cash flows for more than a few years with any accuracy is nearly impossible. I’ve seen DCF models produce valuations that differ by 50% from analyst to analyst using the same company, simply because they made different assumptions about terminal growth rates or discount rates.
This doesn’t mean DCF is useless. It means you need to use it for what it actually tells you: sensitivity analysis rather than a precise number. Run the model with conservative, moderate, and aggressive assumptions. If the stock looks undervalued across all reasonable scenarios, you have a genuine candidate. If it only looks cheap under the most optimistic assumptions, you’re not finding value—you’re gambling.
Practical approach: use DCF to understand a company’s value drivers. What growth rate is the market implicitly pricing in? What discount rate? When you reverse-engineer the model—solving for the growth rate that would justify the current price—you understand exactly what the market expects. If you believe the company can exceed those expectations, you have a thesis.
For example, if a stock trades at $50 and your DCF model suggests fair value is $70, that’s interesting. But more interesting is asking: “What growth rate would justify $50?” If the answer is 3% annual growth when the company has grown at 12% for the past decade, you’ve identified a market that’s underestimating the business’s potential. That’s where outperformance comes from.
Dividend Yield: Income That Signals Value
Dividend yield gets ignored by growth-oriented investors, but it’s one of the most reliable indicators of value when used correctly. A stock yielding 5% in a market where the S&P 500 yields 1.5% is either a bargain or a warning—your job is to figure out which.
The key is distinguishing between sustainable yields and traps. A company maintaining a 6% yield while its earnings are declining is not undervalued—it’s cutting into the bone to maintain the dividend, and the yield will rise further as the price collapses. Look instead for companies with yields above their historical average, stable or growing earnings, and dividend payout ratios below 70%. This combination suggests the yield is supported by genuine cash flow, not accounting manipulation or desperate attempts to maintain shareholder appearance.
One underappreciated application: compare dividend yields across sectors. Financials and utilities typically yield more than tech companies—not because they’re better businesses, but because their growth profiles are lower and their cash generation is more stable. A tech company yielding 3% is far more unusual and potentially more significant than a utility at the same yield.
The screening approach: filter for companies with dividend yields above 3%, earnings per share that have increased in each of the past five years, and payout ratios below 60%. This narrows the field to businesses that can afford their dividends and have demonstrated the stability that makes a high yield meaningful.
Free Cash Flow Yield: The Cash Basis Others Miss
Free cash flow—what remains after capital expenditures—matters more than accounting earnings. A company can report GAAP profits while burning cash in operations. Free cash flow is the actual economic output available for dividends, share repurchases, debt reduction, or reinvestment.
Free cash flow yield expresses this as a percentage: free cash flow per share divided by the stock price. A yield of 8% means the company generates enough cash to return 8% of your investment annually through actual distributions or share repurchases, regardless of what accounting rules say about earnings.
This metric is particularly valuable in industries with high capital requirements—telecommunications, airlines, utilities—where earnings can be distorted by depreciation assumptions. Two airlines with identical GAAP earnings can have radically different free cash flow depending on their fleet decisions, lease structures, and capital maintenance requirements. The one with higher free cash flow is generating real value; the other may be consuming capital while appearing profitable.
Screen for free cash flow yields above 5% in industries where you understand the capital dynamics. Combine this with a look at the free cash flow trajectory: is it growing, stable, or declining? A company with a 5% yield but declining free cash flow is less attractive than one with a 4% yield that’s growing cash generation at 10% annually.
Relative Strength: When the Market Is Right (Even When It Seems Wrong)
Here’s the uncomfortable truth that most value investors resist: the market is often right about which stocks to avoid, even when it’s wrong about price. Relative strength analysis—comparing a stock’s performance against the broader market and its sector—reveals where institutional investors are directing their money and attention.
A stock that’s underperforming while its earnings are stable often has hidden problems: management issues, competitive threats, or fundamental shifts in its end markets that you haven’t yet discovered. Conversely, a stock that’s outperforming the market while trading at premium valuations may simply be reflecting genuine quality that justifies those valuations.
The practical application isn’t to blindly follow relative strength, but to use it as a filter. Start with your fundamental screens—low P/E, low P/B, high dividend yield—and then overlay a relative strength check. Has this stock been outperforming or underperforming its sector over the past 6-12 months? If it’s been underperforming despite solid fundamentals, you may have found a market mispricing. If it’s been outperforming, the fundamentals may already be reflected in the price.
This is where many investors go wrong: they find a stock that looks cheap by traditional metrics, ignore the fact that it’s been declining for two years, and buy it expecting a rebound. Often, that decline reflects legitimate concerns about the business that haven’t fully manifested in the financials yet. Relative strength won’t tell you everything, but it will save you from the most obvious value traps.
Finding Undervalued Stocks Across Market Cycles
The methods above work differently depending on where we are in the market cycle. This is where most generic investment articles fall apart—they give you a list of metrics without explaining how to adjust your approach.
In bull markets, growth stocks typically outperform, and value metrics become less effective at identifying opportunities. P/E ratios expand across the board, making even fairly valued companies look expensive by historical standards. Your best approach in bull markets: focus on relative strength, quality at a reasonable price (GARP strategies), and companies where growth expectations are underestimated by the market. The key is finding businesses that can grow into their valuations faster than the market expects.
Bear markets are where patient value investors excel. The panic selling that characterizes bear markets creates the widest gaps between price and intrinsic value. During the 2008 financial crisis and the 2020 COVID crash, quality companies with strong balance sheets traded at valuations not seen in decades. Your approach: shift toward companies with stable earnings, strong balance sheets, and dividends that can survive a recession. The P/B and free cash flow metrics become more reliable when panic-driven selling disconnects prices from fundamentals.
Sideways markets—the grinding periods between clear trends—are actually the most difficult environment for stock selection. Neither growth nor deep value has a structural advantage. The best strategy: focus on companies with specific catalysts you can identify. Management changes, new product launches, industry consolidations, or regulatory shifts can drive stock performance in markets where broad tailwinds are absent.
The honest admission most articles avoid: timing cycles is nearly impossible. The market doesn’t conveniently tell you when a bull market is ending or a bear market is bottoming. What you can do is adjust your weightings based on current valuations and your own risk tolerance. When valuations across the market are historically high, become more conservative. When they’re historically low, you can afford to take more risk.
Tools That Make This Practical
All these methods require data, and the good news is you don’t need expensive terminals to implement them.
TradingView offers powerful free screening capabilities with the advantage of visual charts integrated with your screening. You can build multi-factor screens combining valuation metrics, dividend data, and technical indicators in one interface. The screener updates in real-time as market data changes.
Finviz provides a cleaner, simpler interface optimized for quick screening across the major valuation metrics. Their heat map view helps you spot sector-level patterns quickly. It’s less sophisticated than TradingView but faster for initial idea generation.
Yahoo Finance offers surprisingly robust screening for a free platform, with the ability to filter by the specific metrics I’ve discussed. The advantage: everything links directly to company pages with detailed financials, analyst estimates, and news—all without leaving the ecosystem.
If you’re willing to invest in a subscription, FactorPad provides educational resources alongside their data tools, specifically designed for learning systematic value investing. Their videos explain each metric and show real examples of how to apply them.
The tools matter less than the discipline. You can build a perfectly reasonable screen in fifteen minutes on any of these platforms. The challenge is doing the work after that—reading the annual reports, understanding the business, and making judgment calls that no screen can automate.
Common Mistakes That Cost More Than Bad Picks
I’ve watched investors make the same errors repeatedly, and they have nothing to do with which metric they choose. The mistakes are behavioral.
The first is overreliance on a single metric. Someone finds a stock with a P/E of 8 and gets excited without checking whether earnings are declining, debt is exploding, or the industry is being disrupted. No metric is sufficient alone. Always verify your findings with at least three different approaches.
The second mistake is ignoring balance sheet health. A company can have attractive earnings and a low valuation while carrying debt that will eventually destroy shareholder value. Before buying any “undervalued” stock, check the debt-to-equity ratio, interest coverage, and cash flow relative to debt obligations. The 2008 financial crisis taught this lesson painfully—banks had “attractive” valuations right up until they weren’t.
The third mistake is chasing yield without understanding sustainability. High yields that get cut devastate total returns. A stock yielding 8% that subsequently cuts its dividend to 2% will likely lose you money even after the initial yield looked attractive.
The fourth mistake, and perhaps the most costly: refusing to sell when the thesis breaks. Finding an undervalued stock is only half the battle. Holding it when the market continues to punish it, or when your original thesis proves wrong, requires genuine conviction backed by ongoing analysis. Pride and loss aversion keep investors holding losing positions long past the point of rationality.
Conclusion
The search for undervalued stocks isn’t a formula you learn once and apply forever. It’s an ongoing practice of questioning assumptions, verifying claims with multiple data points, and maintaining the intellectual flexibility to adapt as market conditions change. The seven methods covered here—P/E, P/B, PEG, DCF, dividend yield, free cash flow yield, and relative strength—give you a framework for systematic analysis, but none of them work in isolation.
What separates investors who consistently find hidden gems from those who chase every “cheap” stock they find is discipline in the application. They understand that a low number without context is just a number. They verify, cross-check, and maintain a margin of safety that accounts for their own fallibility. And critically, they adjust their approach based on where we are in the cycle, recognizing that what works in bull markets often fails in bear markets and vice versa.
The honest truth is that even with rigorous analysis, you’ll be wrong often. Some of your undervalued stocks will stay undervalued for years before the market catches on; others will decline further as you discover problems you missed. The goal isn’t perfection—it’s building a process that generates positive expected returns over time and having the patience to let that process work.
Start with the metrics that match your expertise and interest, build a screening system that combines at least three of them, and commit to doing the fundamental work that no screen can automate. That’s where the real advantage lies—not in the tools, but in the discipline and judgment you bring to their use.