If you’re evaluating SaaS stocks or running a subscription business, there’s one metric that separates companies that compound from those that merely survive. Net Revenue Retention (NRR) tells you whether your existing customers are becoming more valuable over time—or slowly draining away. For investors, NRR has become one of the most predictive indicators of growth stock outperformance over the past decade. The data is consistent across public markets and private portfolios: companies with NRR above 120% consistently deliver 2-3x the returns of their peers with lower retention.
This isn’t a vanity metric. NRR answers a fundamental question: if you stopped acquiring new customers entirely, would your revenue grow, shrink, or stay flat? That answer determines whether your business model is sustainable or whether you’re on a treadmill requiring constant new customer acquisition just to maintain revenue. For public market investors, this distinction matters—companies with high NRR trade at premium multiples because analysts can model them as compounding machines rather than businesses constantly reinventing their customer base.
What Is Net Revenue Retention (NRR)?
Net Revenue Retention measures the percentage of recurring revenue retained from existing customers over a specific period, accounting for expansions, contractions, and cancellations. Unlike simple customer retention or churn metrics, NRR captures the net effect of customer behavior.
The key insight NRR provides is whether your customers are voting with their wallets for more of your product. A company with 90% gross retention but zero expansion revenue has fundamentally different economics than one with 90% gross retention but 40% expansion revenue—the latter has 130% NRR and can grow profitably without adding a single new customer. This distinction is why NRR has become the primary metric for evaluating SaaS businesses, particularly in the public markets where quarterly reporting demands cleaner metrics.
NRR is distinct from Gross Revenue Retention (GRR), which measures only the revenue retained before accounting for expansions. GRR can never exceed 100%—it simply tracks what percentage of your starting revenue base remains after churn and downgrades. NRR, by contrast, can exceed 100% when expansion revenue from existing customers exceeds the revenue lost to churn and contraction. This ceiling-less quality is what makes NRR the superior metric for identifying truly compounding businesses.
The NRR Formula and How to Calculate It
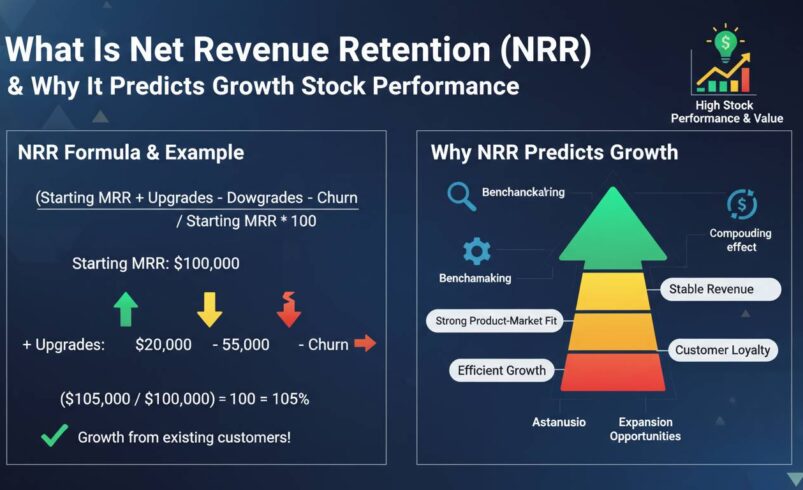
The NRR formula combines four components into a single percentage:
NRR = (Starting MRR + Expansion MRR – Contraction MRR – Churned MRR) ÷ Starting MRR × 100
Let’s break this down with a concrete example. Imagine a SaaS company starts Q1 with $1,000,000 in Monthly Recurring Revenue. During the quarter, existing customers add $150,000 in expansion revenue (upgrades, additional seats, new modules), while $80,000 in contracts downsize or reduce their plans, and $70,000 in customers churn entirely. The calculation would be:
NRR = ($1,000,000 + $150,000 – $80,000 – $70,000) ÷ $1,000,000 × 100 = 100%
This company maintained flat revenue from its existing base—no growth, no shrinkage. Now consider the same starting base with stronger expansion and lower churn: $200,000 expansion, $50,000 contraction, $30,000 churned.
NRR = ($1,000,000 + $200,000 – $50,000 – $30,000) ÷ $1,000,000 × 100 = 112%
That 12% net expansion from existing customers means this business can grow 12% annually without adding a single new customer. In a competitive acquisition environment where customer acquisition costs (CAC) continue rising, the economic advantage of expansion revenue is substantial—it’s typically 5-7x more profitable than new customer revenue because there’s no associated CAC.
For public companies reporting quarterly, the calculation typically uses annual figures or a trailing twelve-month (TTM) basis to smooth out seasonality. Many SaaS companies now report NRR in their earnings releases—companies like Snowflake, Datadog, and Cloudflare regularly cite NRR figures above 130%, which signals strong land-and-expand dynamics.
Why NRR Predicts Growth Stock Performance
The correlation between NRR and stock performance isn’t theoretical—it’s observable across public market data from the past decade. Andreessen Horowitz tracked this relationship, demonstrating that SaaS companies with NRR above 120% generated median returns 3x higher than companies with NRR below 100%. More recent analysis from Bessemer Venture Partners confirms this pattern persists: high-NRR companies command premium valuations because their revenue trajectories are more predictable and their unit economics are demonstrably superior.
The mechanism is straightforward. High NRR indicates product-market fit at the account level—customers aren’t just staying, they’re investing more in the relationship. This creates a compounding feedback loop: more usage generates more value, which drives expansion, which deepens the relationship, which reduces churn probability. Companies trapped below 100% NRR are fighting gravity—they must continuously acquire new customers at rates exceeding their leakage just to maintain revenue, a costly and increasingly difficult proposition as markets mature.
Consider the public market performance of Snowflake versus traditional enterprise software companies. Snowflake consistently reports NRR above 170%, and while their stock has experienced volatility, their revenue growth trajectory remains exceptional because their existing customer base is fundamentally expanding. In contrast, legacy enterprise software companies with NRR around 100% struggle to grow beyond single digits—they’re effectively mature businesses with limited expansion upside, regardless of how much they invest in sales and marketing.
For growth investors, NRR serves as a forward-looking indicator because it captures customer behavior before that behavior appears in financial statements. A company with accelerating NRR is likely experiencing product-led growth that will manifest in revenue and earnings over the following quarters. Conversely, declining NRR—even if masked by new customer acquisition in the short term—typically predicts future revenue shortfalls as the expansion engine stalls.
The valuation premium for high-NRR companies reflects this predictability. As of early 2025, SaaS companies with NRR above 130% trade at median revenue multiples of 8-12x, while companies below 100% NRR typically trade at 3-5x revenue. The market is essentially pricing in the compounding certainty that high-NRR businesses provide—their revenue base is self-reinforcing in ways that lower-retention competitors cannot replicate.
What Is a Good Net Revenue Retention Rate?
Benchmarks vary significantly by company stage, market segment, and business model, but certain thresholds have emerged as meaningful signals in the SaaS industry.
Below 100%: This is a warning sign. Your existing customers are collectively becoming less valuable over time. Unless you’re in a rapidly shrinking market, this typically indicates product weakness, poor customer success investment, or pricing pressure from competitors. Companies consistently below 100% NRR face an uphill battle—they’re burning capital to stand still.
100-110%: This represents the baseline for healthy businesses. You’re retaining customers but not expanding them meaningfully. This is acceptable for transactional or commodity SaaS products but leaves significant value on the table. There’s no compounding occurring—the business grows only through new customer acquisition.
110-120%: This is the range where things get interesting. You’re successfully expanding some accounts while maintaining most of your base. These companies typically demonstrate efficient growth and can achieve profitability earlier than peers because their CAC payback periods are shorter. This is the minimum threshold most growth investors look for.
120-130%: This indicates strong product-market fit with meaningful land-and-expand dynamics. Customers see increasing value from your product over time and are willing to pay more. These companies can grow 20-30% annually while becoming increasingly capital-efficient. The market typically rewards this level of NRR with premium valuations.
Above 130%: This is exceptional. Companies like Zoom, Snowflake, and ServiceNow have historically reported NRR above this threshold. At these levels, your existing customers are effectively doubling your revenue base every 4-5 years without any new customer acquisition. This is the compounding zone where the business becomes almost self-sustaining, and it’s why these companies have generated outsized stock returns.
Enterprise companies typically show higher NRR than mid-market or SMB-focused businesses because enterprise relationships are deeper, switching costs are higher, and land-and-expand motions are more pronounced. A Fortune 500 company might start with a small pilot and expand across dozens of departments over years—an SMB customer is more likely to churn when they face financial difficulties or find a cheaper alternative.
How to Improve Your Net Revenue Retention
Improving NRR requires deliberate investment in customer success, product development, and go-to-market strategy. The most effective levers typically involve expanding value before trying to extract more revenue.
Invest in customer onboarding and time-to-value: Customers who achieve their initial success goals early are dramatically more likely to expand. Companies that obsess over reducing time-to-value—getting customers to their first meaningful outcome—see cascading effects on expansion. Measure time-to-value religiously and treat it as a leading indicator of NRR.
Build expansion paths into your product architecture: If your product doesn’t naturally lend itself to expansion—additional seats, premium features, adjacent modules—customers have nowhere to go when they want to invest more. The best SaaS products are designed from inception with expansion in mind, creating natural vectors for growth within existing accounts.
Implement proactive customer health scoring: Reactive customer success teams wait for customers to express dissatisfaction. Proactive teams identify at-risk accounts weeks or months before churn, enabling intervention. The difference shows up directly in NRR—early detection of contraction signals allows you to address root causes before they manifest as lost revenue.
Create customer success programs that drive adoption: Formal customer success programs—including regular business reviews, executive sponsorship, and targeted training—consistently correlate with higher NRR. These programs formalize the value delivery conversation and create natural opportunities to discuss expansion.
Price strategically for value realization: Annual price increases are common in SaaS, but timing matters. The best approach ties price increases to demonstrable value delivery—showing customers exactly what new capabilities they’re receiving justifies the increase and actually increases NRR by driving customers to expand their usage to maintain their previous value-to-cost ratio.
One counterintuitive reality: some companies improve NRR by raising prices strategically rather than by expanding features. When price increases are perceived as justified by value delivered, customers often upgrade their tiers to maintain their feature access, effectively expanding revenue while reducing churn. The key is ensuring customers perceive the increase as fair—opaque or unjustified pricing changes typically accelerate churn and damage NRR.
Common Mistakes When Calculating NRR
Even sophisticated finance teams frequently miscalculate NRR in ways that distort their understanding of business health. Avoiding these errors is essential for using the metric effectively.
Including new customer revenue in the denominator: The formula explicitly uses starting MRR—the revenue from customers who existed at the beginning of the period. Adding new customers acquired during the period inflates the denominator and understates your actual retention. This mistake is surprisingly common and can overstate NRR by 10-20 percentage points.
Failing to account for plan migrations: When a customer downgrades from an enterprise plan to a professional plan, that’s contraction revenue that must be captured. Companies with complex pricing architectures sometimes miss these migrations in their calculations, particularly when they occur within the same customer account.
Inconsistent time periods: Comparing quarterly NRR to annual NRR without understanding the seasonality can lead to erroneous conclusions. Enterprise sales often exhibit significant quarterly patterns—a company might show 140% NRR in one quarter due to large enterprise expansions and 95% in another due to budget-driven churn. TTM calculations smooth this volatility but introduce lag.
Not segmenting by customer cohort: Aggregate NRR can mask significant variation across customer segments. A company might show 115% overall NRR while SMB customers are churning at alarming rates and enterprise accounts are expanding dramatically. Understanding NRR by segment reveals actionable insights that the aggregate number obscures.
Confusing NRR with GRR: This is the most fundamental error. Gross Revenue Retention excludes expansion revenue entirely—you’ll never exceed 100% GRR. Some companies deliberately conflate these metrics to appear healthier than they are. Always verify which metric is being reported and insist on NRR for strategic analysis.
Frequently Asked Questions
What is a good net revenue retention rate for SaaS companies?
A good NRR for SaaS companies is typically above 110%, with excellent performance considered 120% or higher. Enterprise-focused SaaS companies often achieve 130%+ NRR due to their land-and-expand motion, while SMB-focused companies typically see 100-110% as strong performance.
How is NRR different from ARR?
NRR measures the percentage of existing customer revenue retained and expanded over a period, expressed as a percentage that can exceed 100%. ARR (Annual Recurring Revenue) is an absolute revenue figure representing total annualized recurring revenue from all customers. NRR is a retention and expansion metric; ARR is a revenue sizing metric.
Why does NRR matter more than gross retention?
NRR captures net customer behavior including expansions, while gross retention can only measure retention or shrinkage. A company with 90% gross retention but 40% expansion has 130% NRR—far superior to a company with 95% gross retention and zero expansion at 95% NRR. The expansion component is what drives compounding economics.
How often should NRR be calculated?
Most SaaS companies calculate NRR monthly for internal operational purposes and report quarterly or annually for external stakeholders. Monthly calculation provides the most actionable data for customer success teams, while quarterly or annual reporting aligns with financial disclosure requirements.
The Road Ahead
NRR has evolved from an interesting SaaS metric to a fundamental driver of equity valuation in the cloud computing space. The consistency of the correlation between NRR and stock performance over the past decade suggests this relationship isn’t a market anomaly but rather a structural feature of how investors assess subscription business models. As the market continues to mature, expect NRR to become an even more prominent factor in investment analysis—and for companies that master the metric to continue outperforming.
The real question isn’t whether NRR matters—it’s how the metric will evolve as SaaS business models themselves change. Product-led growth, usage-based pricing, and AI-native workflows are creating new dynamics that traditional NRR calculations may not fully capture. Whether NRR remains the preeminent indicator of growth stock performance or gets supplemented by new metrics as the industry transforms is something I’m watching closely. What seems certain is that understanding how effectively companies retain and expand existing customer relationships will remain central to evaluating growth equities for the foreseeable future.