
Every growth stock investor should ask a simple question that most forget: just how big can this company actually become? The answer lives in a metric called Total Addressable Market, and it separates investors who spot the next Amazon early from those caught in value traps disguised as growth stories. TAM isn’t just finance jargon—it’s how sophisticated investors find companies with genuine long-term compounding potential versus those with ceilings already baked in. This guide covers what TAM means, how to calculate it, why it matters for evaluating growth stocks, and where conventional market sizing gets it wrong.
What is Total Addressable Market?
TAM represents the complete revenue opportunity available to a product or service if it achieved 100% market share—meaning every potential customer purchased what the company offers. It’s the ceiling, not the floor. The maximum theoretical size of the pie a company could ever capture, regardless of competition, distribution limitations, or practical constraints.
This matters because investors often confuse TAM with the market a company currently serves. A company generating $50 million in annual revenue might look small, but if its TAM is $50 billion, there’s real growth runway ahead. Conversely, a company with $500 million in revenue in a $2 billion TAM is approaching maturity, and future growth will come at someone else’s expense.
Here’s where most introductory articles fail: they treat TAM as a fixed number. TAM itself evolves. Market boundaries expand as technology enables new use cases, as adjacent problems become solvable, and as consumer behavior shifts. The TAM for cloud computing in 2010 looked radically different from 2020—not because the companies changed, but because the definition of what could be moved to the cloud kept expanding.
TAM vs. SAM vs. SOM: Understanding the Hierarchy
Investors who stop at TAM miss the nuance that separates real analysis from surface-level research. The three-tier framework of TAM, Serviceable Addressable Market, and Serviceable Obtainable Market provides structure to evaluate whether a company’s growth narrative holds up.
Total Addressable Market (TAM) is the entire global market opportunity—every possible customer who could theoretically use the product or service, regardless of geography, pricing tier, or distribution channel.
Serviceable Addressable Market (SAM) is the portion of TAM that a company can realistically target given its current business model, geographic focus, product configuration, and go-to-market strategy. A company selling enterprise software in North America might have a global TAM of $100 billion but a SAM of only $25 billion if they’re not selling internationally or to small businesses.
Serviceable Obtainable Market (SOM) is the realistic share of SAM the company can capture in the near term, given competitive dynamics, sales capacity, and current market penetration. This number matters most for near-term revenue projections.
The relationship between these three metrics tells a story. A company with a massive TAM but a tiny SOM relative to its current revenue is either very early in its journey or facing structural barriers to capture. A company with a shrinking SAM—regardless of what the headline TAM suggests—should raise immediate concerns about future growth.
Here’s a practical example. A SaaS company offers project management software. The global productivity software market might be a $50 billion TAM. If this company only targets creative agencies in the United States, their SAM might be $2 billion. If they currently hold 8% of that segment, their SOM is roughly $160 million. An investor looking only at the $50 billion TAM would dramatically overestimate the company’s growth potential.
How to Calculate Total Addressable Market
Three main methodologies exist for calculating TAM, each with distinct strengths and weaknesses. Understanding which approach a company or analyst uses—and why—reveals a lot about the assumptions behind their growth thesis.
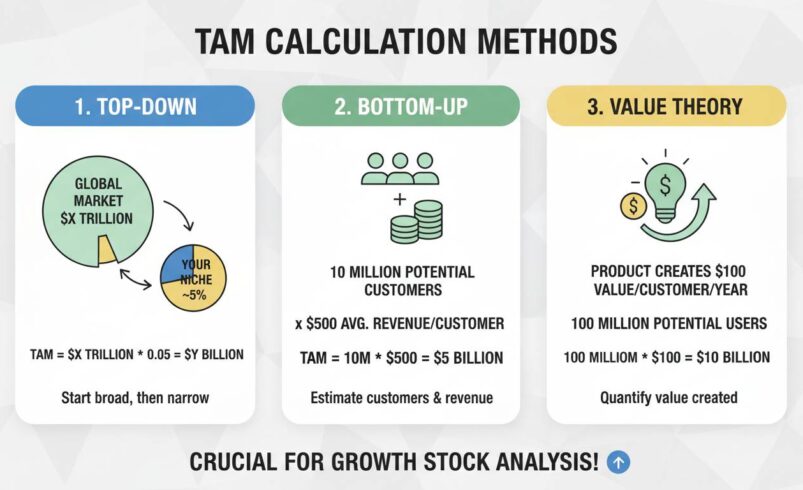
Top-Down Analysis starts with broad market research and narrows through segmentation. An analyst begins with an industry report estimating a $100 billion total market, then applies filters: US only ($40 billion), enterprise segment only ($15 billion), excludes companies already using a competitor ($12 billion). This approach is fast and relies on external research, but carries all the biases and estimation errors of the original market research. It also assumes the analyst’s filters accurately reflect the company’s actual constraints—which they often don’t.
Bottom-Up Analysis builds the market estimate from unit economics and specific customer segments. Rather than trusting an industry report, the analyst starts with the company’s actual customers: what do they pay, how many similar companies exist, what’s the realistic adoption rate among similar businesses. If a product costs $1,000 annually per customer and 500,000 businesses exist in the target segment with reasonable product-market fit, the TAM is $500 million. This approach produces more defensible numbers because it’s grounded in observable transaction data, but requires more granular information and can miss adjacent opportunities the company hasn’t explored.
Value-Theory Analysis estimates TAM based on economic value created rather than current spending. This approach asks: if this product fully solved the problem it’s addressing, how much value would it generate for customers, and what portion could the company capture? This works well for transformative technologies that don’t yet exist in final form. When Salesforce pioneered cloud CRM, the TAM wasn’t just the on-premise CRM market—it was the entire relationship management economy that cloud delivery would unlock, including small businesses previously priced out of any CRM solution.
For growth stock analysis, the bottom-up approach generally produces the most reliable estimates because it’s anchored in actual customer behavior. However, sophisticated investors use all three methods and examine where they converge—and where they diverge significantly.
Why TAM Determines Growth Stock Potential
The connection between TAM and growth stock potential isn’t complicated, but it’s often misunderstood. A company’s stock price ultimately reflects the market’s expectation of future cash flows, discounted back to present value. If those cash flows are constrained by a limited market, no amount of execution excellence will produce the multi-bagger returns that define great growth investments.
Here’s the uncomfortable truth most growth stock analysis ignores: the best-managed company in a shrinking or stagnant market will generate solid returns, but rarely exceptional ones. The compounding engine that drives 10x returns requires a continuously expanding revenue base, and that requires a TAM that either grows organically or expands through the company’s own innovation.
Amazon is the canonical example. When Jeff Bezos described his strategy in the 1990s, he wasn’t building an online bookstore—he was targeting the entire retail market, eventually expanding to cloud computing, advertising, and healthcare. Each time Amazon entered a new market, its TAM expanded dramatically, creating new growth vectors that sustained the stock’s remarkable appreciation. An investor who evaluated Amazon purely on the online book market TAM in 1997 would have completely missed the thesis.
The inverse is equally instructive. A company dominates its niche with 40% market share in a $500 million SAM, generating $200 million in revenue. Even with exceptional execution and expansion into 60% market share, revenue caps at $300 million. The growth multiple is 1.5x under ideal circumstances. Compare that to a company with $50 million in revenue in a $50 billion TAM, holding less than 1% market share. The ceiling on potential revenue—and thus stock appreciation—is orders of magnitude different.
This framework also explains sector rotation in growth portfolios. When a particular market segment reaches saturation—visible through slowing SAM expansion or declining growth rates despite continued market share gains—smart capital migrates to segments with larger, expanding TAMs.
Real-World TAM Examples
Understanding TAM in the abstract is straightforward. Seeing how it operates in actual investment analysis reveals why the metric demands careful attention.
Tesla’s Automotive TAM shows the danger of accepting headline numbers. Tesla’s automotive TAM is often cited as the global vehicle market—roughly $3-4 trillion annually. However, Tesla’s actual SAM is constrained: they only produce premium vehicles, manufacturing capacity limits production to a few million units annually, and they compete in specific geographic markets. The gap between the headline TAM and Tesla’s realistic SAM is enormous. Investors who fail to recognize this overestimate the company’s growth runway.
Snowflake’s Data Cloud TAM demonstrates the opposite. Snowflake positions itself in the data infrastructure market, but their TAM expands continuously as they add new data workloads, new geographic markets, and new use cases beyond their original cloud data warehousing focus. Each product launch—Data Sharing, Data Lake, Cortex AI—effectively expands their addressable market, creating growth vectors that weren’t part of the original thesis.
Shopify’s Commerce TAM shows how a company can expand its own TAM through platform strategy. Originally an e-commerce platform for small businesses, Shopify expanded into enterprise (Shopify Plus), fulfillment (Shopify Fulfillment Network), payments (Shopify Payments), and capital (Shopify Capital). Each expansion didn’t just add revenue—it expanded the addressable market by moving into adjacent segments that share the same customer base but need different solutions.
Netflix’s Streaming TAM reveals both expansion and contraction. Netflix’s TAM expanded dramatically as streaming replaced physical media and expanded globally. However, competitive intensity in streaming—faced with Disney+, Amazon Prime, Apple TV+, and others—has effectively compressed the portion of TAM any single company can capture. The overall streaming market keeps growing, but the revenue ceiling for any individual player is lower than it appeared when Netflix faced less competition.
The Critical Limitations of TAM Analysis
TAM analysis, as commonly applied, has significant limitations that intelligent investors must acknowledge.
First, TAM estimates are frequently produced by the companies themselves. When a startup presents its TAM, it’s almost always calculated to support a favorable investment narrative. The top-down number is the maximum possible market, the value-theory number assumes perfect execution and market capture, and neither figure reflects realistic competitive constraints. Always triangulate company-provided TAM with independent research—and be skeptical when numbers don’t match external estimates.
Second, TAM says nothing about competitive dynamics. A $50 billion TAM with three entrenched incumbents and switching costs is fundamentally different from a $50 billion TAM with no dominant players and network effects favoring newcomers. The TAM number is the same; the investable opportunity is radically different.
Third, TAM calculations often assume current consumption patterns remain valid. The value-theory approach addresses this partially, but some TAM estimates implicitly assume existing pricing and demand structures persist even as the market transforms. When a truly disruptive technology arrives, it doesn’t just capture existing market share—it creates new demand from customers who previously couldn’t afford or access the solution. The iPhone didn’t just capture the smartphone market; it created the app economy, mobile advertising, and mobile commerce TAMs that didn’t previously exist.
Fourth, the relationship between TAM and stock returns isn’t linear. A company with a massive TAM can still be a terrible investment if it’s overvalued relative to that TAM, if competitive dynamics prevent capture, or if execution falls short. TAM is necessary but not sufficient for growth stock success.
Calculating TAM for Your Investment Research
Here’s how to apply TAM analysis in practice when evaluating growth stocks.
Start by distinguishing between the company’s stated TAM and independent estimates. Company presentations will almost always use the largest defensible number—often a value-theory approach that assumes maximum market capture. Seek third-party research: industry analyst reports, academic papers, and competitive analysis from firms without a financial stake in the company’s success.
Next, evaluate the SAM carefully. The SAM should represent the market the company can realistically target given its current resources, geographic presence, product maturity, and go-to-market approach. Ask: does the company have the sales infrastructure, product capabilities, and brand recognition to capture this SAM? If not, when will they?
Then examine the trend line. Is the SAM expanding or contracting? A growing SAM—driven by market tailwinds, adjacent market entry, or new use cases—provides optionality that compounds over time. A shrinking or stagnant SAM limits growth to market share capture, which is a zero-sum game typically requiring significant capital expenditure.
Finally, calculate the ratio between current revenue and TAM as a sanity check. A company with $100 million in revenue and a $1 billion TAM has significant runway—but only if they can realistically capture more of that market. A company with $100 million in revenue and a $100 billion TAM is either dramatically undervalued or facing structural barriers that prevent market capture.
Conclusion
Total Addressable Market isn’t a magic number that guarantees investment success, but it’s an indispensable framework for separating genuine growth opportunities from inflated narratives. The companies that generate exceptional long-term returns almost always share one characteristic: they operate in markets large enough to support sustained expansion, and they possess competitive advantages that allow them to capture an increasing share of that market over time.
The next time you evaluate a growth stock, start with this question: what is the realistic ceiling on this company’s revenue, and is the current stock price justified by that ceiling? If the TAM analysis doesn’t support a path to meaningful appreciation, no amount of momentum or sentiment will change the fundamental math. The market sizes what matters—and smart investors do the same.


