
Most investors understand the P/E ratio. They stare at it, compare it to competitors, and feel smug when they find a stock trading at 12x earnings while the industry sits at 20x. But here’s the uncomfortable truth: P/E alone is almost useless for finding genuinely cheap stocks. It tells you what you’re paying but says nothing about what you’re getting.
That’s where the PEG ratio comes in. It’s not a magic bullet, but it does something P/E can’t: it makes you think about growth instead of just price.
What Is the PEG Ratio?
PEG measures a stock’s valuation by comparing its P/E ratio to its earnings growth rate. A stock trading at 20x earnings might seem expensive—but if earnings are growing at 40% annually, that valuation might actually be justified. Conversely, a stock at 8x earnings could be a trap if earnings are declining.
The formula:
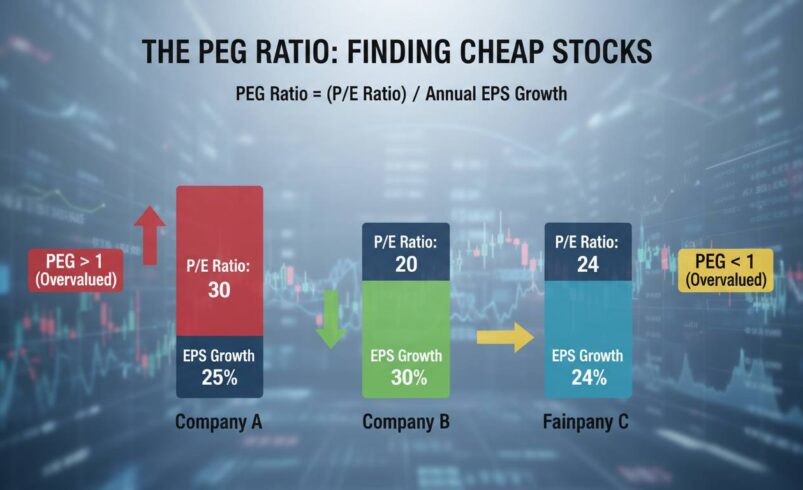
PEG = P/E Ratio ÷ Expected Earnings Growth Rate
A PEG of 1.0 means price and growth are perfectly aligned. Below 1.0 suggests potential undervaluation. Above 1.0 means you’re paying a premium for the growth you’re getting.
Peter Lynch famously said a PEG of 1.0 represents fair value. The reality is messier than that, obviously, but Lynch got the core idea right: growth matters, and P/E alone conceals as much as it reveals.
How to Calculate PEG Ratio
You need three things: the stock’s current price, its earnings per share, and a reasonable estimate of future earnings growth.
First, find the P/E ratio. You can use trailing P/E (actual earnings over the past 12 months) or forward P/E (analyst estimates for the next 12 months). Forward P/E tends to work better for PEG calculations because you’re comparing current price to expected growth.
Next, get the expected earnings growth rate. Analyst estimates are the standard source—you’ll find them on any major financial website. You could use historical growth rates for a more conservative approach, though this creates problems if the company’s trajectory is changing.
Here’s a real example. As of early 2025, Microsoft trades around $420 with forward earnings near $12.50 per share, giving a forward P/E of roughly 34. Analysts expect earnings to grow about 14% annually over the next three to five years. Divide 34 by 14 and you get a PEG around 2.4—expensive by traditional standards.
Now look at Johnson & Johnson. Around $160 with forward earnings near $10.20 gives a P/E of about 16. Expected growth sits around 6%, so the PEG comes to roughly 2.7. Even though JNJ has a lower P/E, Microsoft actually offers more growth per dollar of valuation.
This is the key insight: never compare P/E ratios across companies in different growth phases. A 25x P/E might be cheap for a 20% grower and expensive for a 5% grower. PEG normalizes this.
Interpreting PEG Ratios
The standard framework:
| PEG Ratio | Interpretation |
|---|---|
| Below 1.0 | Potentially undervalued |
| 1.0 | Fair value |
| 1.0 to 2.0 | Reasonably valued to slightly expensive |
| Above 2.0 | Potentially overvalued |
These thresholds work as starting points, but context matters. A PEG of 0.8 might seem like a bargain until you find out why the market is discounting the stock—sometimes the market sees something you don’t.
Comparing PEGs within sectors makes more sense than comparing across industries. If you’re evaluating semiconductor stocks, compare their PEGs to each other, not to utility companies. What counts as expensive in biotech differs from what counts as expensive in consumer staples.
Tracking how a company’s PEG changes over time is useful, too. A PEG dropping from 1.5 to 0.8 could mean a bargain is developing—or it could mean deteriorating growth prospects. The difference matters enormously for your investment thesis.
What Constitutes a Good PEG Ratio
It depends on the type of company. Growth investors can justify higher PEGs because they’re betting on explosive earnings expansion. Value investors should lean toward lower PEGs, but not exclusively.
For fast-growing tech companies, a PEG up to 2.0 is often justified during strong growth phases. NVIDIA has traded at PEGs well above 2.0 for years while delivering returns because actual growth exceeded even optimistic estimates. The catch is expected growth—PEG is only as good as your growth estimate.
For mature companies in stable industries, PEGs above 1.5 usually signal overvaluation. Banks, utilities, and consumer staples should trade closer to 1.0 or below to qualify as genuine value.
One thing that bugs me: a PEG below 0.5 should make you suspicious, not excited. Yes, the math suggests massive undervaluation. But think about what has to be true for a PEG that low. Either the market is massively mispricing a quality company (possible but rare), or—more likely—the market is correctly pricing deteriorating fundamentals. Always ask: why is this cheap?
Real example: in late 2023 and early 2024, many energy stocks traded at PEGs below 0.5. Was this a value opportunity? Partially. But those low PEGs reflected real concerns about commodity price cycles and energy transition headwinds. Some were bargains; others were traps. The PEG told you something was cheap. It didn’t tell you why.
Where to Find Low-PEG Stocks
Screening tools help identify opportunities. Finviz offers a free stock screener where you can filter for PEG ratios below 1.0, 0.5, or whatever threshold fits your strategy. Combine this with market cap, sector, and dividend yield to narrow results.
Yahoo Finance’s screener includes PEG as a filter. Morningstar provides PEG data alongside fundamental analysis—useful when you want deeper research on candidates your initial screen identifies.
Most brokers offer built-in screeners. Fidelity, Charles Schwab, and TD Ameritrade all include PEG-based filtering.
For context, remember that sector averages differ. Technology and healthcare tend to trade at higher average PEGs due to structural growth. Utilities, financials, and energy typically average lower. When screening, compare candidates to their sector norms, not the broad market.
As of early 2025, some interesting PEG dynamics exist. Regional banks have seen compressed valuations amid commercial real estate concerns, with some trading at PEGs below 0.8—reflecting both real risks and potentially excessive pessimism. Healthcare services companies, particularly those benefiting from aging demographics, occasionally appear at PEGs that don’t fully reflect their growth tailwinds.
Limitations of the PEG Ratio
This is where most articles fall short, and it’s also where you’ll find the most useful insights if you’re willing to think critically.
Growth estimates are unreliable. Analyst consensus might be wrong by 50% or more, especially for high-growth companies where small changes in revenue assumptions create massive swings in earnings projections. Using historical growth rates solves one problem (optimistic analysts) but creates another (past performance doesn’t guarantee future results).
PEG breaks down for companies with negative earnings. You can’t calculate a P/E ratio for a loss-making company, which means growth stocks in their early stages often get excluded from PEG analysis entirely. This creates a systematic bias: PEG favors companies that are already profitable and penalizes businesses still investing in growth.
The ratio fails for cyclical companies. Energy stocks, materials companies, and industrials often have highly variable earnings that make forward growth estimates meaningless. A cyclical company might show a PEG of 0.3 in the middle of a boom (because earnings are about to decline) or a PEG of 5.0 during a downturn (because earnings are about to recover). Using PEG on cyclical stocks without adjusting for the cycle is a recipe for poor timing.
A low PEG often signals problems, not opportunities. When a quality company’s PEG drops below 1.0, investigate why. Has the market spotted declining competitive advantages? Is there a regulatory threat? Is management guiding lower? The PEG doesn’t know. Neither will you unless you do the fundamental research.
Here’s the uncomfortable truth: PEG is a screening tool, not a final verdict. It helps you identify candidates worth examining further. It cannot tell you whether a stock is actually cheap. For that, you need to understand the business, the industry dynamics, and the competitive position. A stock with a PEG of 0.5 might be the bargain of the decade—or it might be a dying business about to cut its dividend.
Using PEG With Other Metrics
No single metric tells the complete story. The most effective investors use PEG as one input among many.
Combine PEG with cash flow analysis. A company trading at a low PEG but burning cash is very different from one generating strong free cash flow. Look at price-to-free-cash-flow alongside PEG to ensure you’re not chasing a mirage.
Add debt analysis. A low-PEG company with a drowning balance sheet is risky regardless of valuation. The 2008 financial crisis wiped out many “cheap” bank stocks that had low PEGs right before they collapsed. Leverage kills.
Consider return metrics. A low-PEG company with declining ROE is less attractive than one maintaining strong returns despite its valuation discount. ROIC and ROE provide essential context.
Use PEG alongside dividend metrics for value stocks. A company with a 3% dividend yield and a PEG below 1.0 might offer both income and growth potential—if the dividend is sustainable. Check the payout ratio. A 90% payout ratio with a low PEG suggests the dividend might be at risk.
Practical framework: start with PEG to identify candidates, then filter for strong free cash flow, reasonable debt levels, and sustainable competitive advantages. PEG gets you in the door; the rest of your analysis determines whether you stay.
Finding Actually Cheap Stocks With PEG
The PEG ratio won’t make you a successful investor on its own. It won’t tell you which growth estimates are accurate or which low-PEG stocks have sustainable competitive advantages. What it does is reframe the valuation conversation in a way that forces you to think about growth explicitly rather than relying on P/E alone.
The investors who use PEG most effectively treat it as a starting point, not a final answer. They screen for low-PEG candidates, then do the hard work of understanding why those stocks trade where they do. They accept that a low PEG might signal a bargain—or it might signal a trap. They use other metrics to distinguish between the two.
Start by running your own screens. Filter for PEGs below 1.0 in sectors you understand. Research each candidate thoroughly. Build a watchlist. Over time, you’ll develop intuition for which low-PEG opportunities are worth pursuing and which to avoid.
The stocks that are actually cheap aren’t just the ones with low numbers. They’re the ones where the low numbers reflect market pessimism rather than fundamental weakness—and the PEG ratio is your tool for finding them, not your final verdict.


