
If you’re investing real money without understanding financial ratios, you’re essentially driving blind. The stock market rewards those who can read financial statements the way a pilot reads instruments—constantly and with understanding of what the numbers mean. Financial ratios are the dashboard of investing. They transform accounting data into clear signals about whether a company is healthy, overpriced, or heading for trouble.
Most beginners make the mistake of focusing exclusively on price. They ask “Is this stock cheap?” without understanding that a $20 stock can be ridiculously expensive while a $200 stock can be a bargain. The difference lies in the financial metrics behind the price tag. I’ve spent over a decade analyzing companies for my own portfolio, and I can tell you that the investors who consistently beat the market aren’t necessarily smarter—they’re better at reading these ratios and understanding what each one reveals about a business.
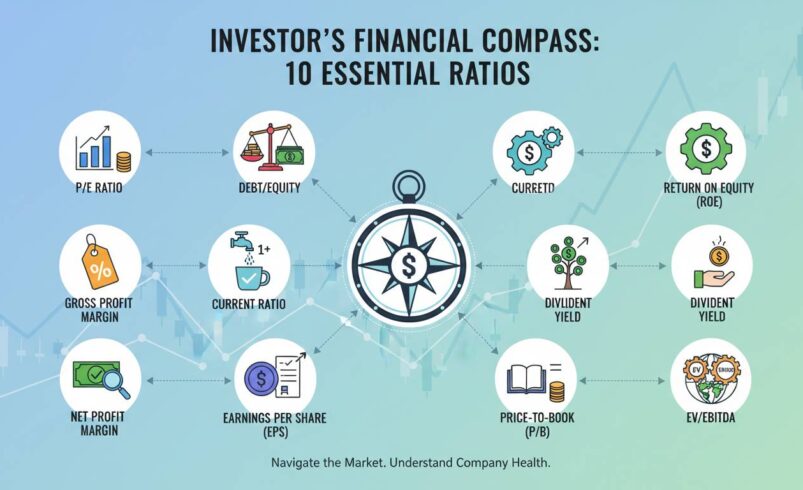
This guide covers the ten ratios I check on every company I consider owning. Some will feel intuitive once you understand them. Others might challenge what you currently believe about what makes a “good” stock. Let’s get into it.
1. Price-to-Earnings Ratio (P/E)
The P/E ratio divides a company’s stock price by its earnings per share. If a company trades at $100 per share and earns $5 per share, its P/E is 20. This is the most frequently cited valuation metric, and that’s both justified and dangerous.
Here’s why it matters: the P/E tells you how much investors are willing to pay for each dollar of earnings. A high P/E means investors expect growth—they’re paying premium prices because they believe future earnings will increase substantially. A low P/E often signals a mature company, a struggling business, or a stock the market has overlooked.
Apple currently trades at a P/E around 28 (as of early 2025), reflecting investor confidence in services revenue growth. Compare that to some regional banks trading at P/E ratios below 8—investors are pricing in potential loan losses and regulatory challenges. Neither is automatically “better.” The question is whether the price matches reasonable expectations for future earnings.
The common mistake beginners make is buying high-P/E stocks because they assume “popular = good” or avoiding low-P/E stocks because they seem “boring.” I once owned a tech company with a P/E of 60 that subsequently dropped 70% when growth slowed. I’ve also made excellent returns on “boring” companies with single-digit P/Es that the market had irrationally punished. Context matters more than the number.
To use this ratio effectively, compare P/E to the company’s historical range, to competitors in the same industry, and to the broader market. A P/E of 25 might be cheap for a tech company expected to grow 30% annually, but expensive for a utility company growing at 3%.
2. Price-to-Book Ratio (P/B)
The P/B ratio compares a company’s market value to its book value—essentially what the company would be worth if it liquidated all assets and paid off all debts. The formula divides market cap by total shareholders’ equity. A P/B below 1 theoretically means the stock trades for less than the company’s net assets.
Value investors adore this ratio, and Warren Buffett built his fortune finding companies with P/B ratios well below market averages. When you buy a company with a P/B of 0.7, you’re paying less than dollar-for-dollar for the assets. If the company liquidates tomorrow, you’d theoretically profit 43% on your investment.
In practice, book value has limitations. Technology companies often have minimal tangible assets—Google’s real value lies in its search algorithms and advertising relationships, not in its office furniture and servers. A tech company with a P/B of 5 isn’t necessarily overvalued if its intangible assets generate massive returns. Meanwhile, a manufacturing company with a P/B of 0.6 might be accurately priced if its equipment is obsolete or its inventory is worthless.
I use P/B as a screening tool rather than a final judgment. A P/B below 1.5 catches my attention, but then I dig into what those book assets actually represent. Are they cash and receivables, or are they a building nobody wants to buy in Toledo?
3. Return on Equity (ROE)
ROE measures how efficiently a company generates profits from shareholder investments. You calculate it by dividing net income by shareholders’ equity. An ROE of 15% means the company generates $15 in profit for every $100 of shareholder equity.
This ratio matters because it answers the fundamental question: is management making good use of the capital investors have entrusted to them? A company with 10% ROE is creating wealth for shareholders. A company with 25% ROE is exceptional—it’s deploying capital far more effectively than most businesses.
I look for consistency here. A company that maintains 18% ROE over ten years is far more valuable than one that spikes to 25% for a single year and then collapses. Consistency signals a durable competitive advantage—a moat that allows the company to keep earning high returns on capital.
Here’s where I’ll disagree with much of the conventional advice: don’t automatically reject companies with lower ROE. A regulated utility might maintain 10% ROE while generating steady, predictable cash flows that bondholders love. An insurance company might operate at 8% ROE but generate returns through leverage that make it extraordinarily profitable for shareholders. The “right” ROE depends entirely on the industry and business model.
What I avoid is companies with declining ROE. If management is investing capital at progressively lower rates of return, something is breaking—either the market is becoming more competitive, or capital allocation decisions are poor.
4. Debt-to-Equity Ratio (D/E)
The debt-to-equity ratio measures a company’s financial leverage by dividing total liabilities by shareholders’ equity. A ratio of 2.0 means the company carries twice as much debt as equity financing.
Debt isn’t inherently evil. Companies use debt to fund growth, acquire competitors, and smooth out cash flow fluctuations. The key question is whether the debt level is appropriate for the business.
Consider two companies: a utility and a software startup. The utility might comfortably carry a D/E ratio of 1.5 or higher because its revenue is stable, its assets are tangible, and it operates in a regulated environment where rate increases can cover interest costs. The software startup should have minimal debt—it burns cash developing products, has few hard assets to pledge as collateral, and needs flexibility to pivot when markets change.
I check D/E against industry averages. A grocery chain with D/E of 3.0 might be conservatively financed. The same ratio at a jewelry retailer would keep me up at night.
The most important application of this ratio is comparing it to the company’s ability to service that debt. Does operating cash flow comfortably exceed interest payments? Is there room to borrow more if an opportunity arises? A company with “good” debt—used for productive purposes at reasonable interest rates—is different from one drowning in obligations it can’t afford.
5. Current Ratio
The current ratio divides current assets by current liabilities—assets expected to convert to cash within a year versus debts due within a year. A ratio above 1.0 means the company has more short-term assets than short-term obligations.
This is a basic liquidity test. If a company has a current ratio of 0.7, it doesn’t have enough liquid assets to pay its near-term bills without raising cash from operations or external financing. That’s a warning sign, particularly for companies in cyclical industries where cash flow can tighten suddenly.
However, the ratio has blind spots. Not all current assets are equally liquid. A company with $10 million in inventory and $8 million in current liabilities shows a healthy current ratio of 1.25—but if that inventory consists of unsold fashion items nobody wants, the ratio is meaningless. Similarly, accounts receivable might include customers who are slow payers or will never pay at all.
I use the current ratio as an initial screen, then verify it with the quick ratio and direct examination of what those assets actually represent.
6. Quick Ratio (Acid Test)
The quick ratio refines the current ratio by excluding inventory. It divides current assets minus inventory by current liabilities. The logic: inventory isn’t always quickly convertible to cash, and in some businesses, it’s perpetually slow-moving.
A quick ratio above 1.0 generally indicates solid short-term financial health. The company can pay its bills without relying on selling inventory.
This ratio becomes crucial when analyzing retail companies. Consider a department store chain with substantial inventory on its books. The current ratio might look fine. But if consumers are shifting purchases online and the inventory consists of outdated merchandise, the quick ratio reveals the more accurate picture—the company might struggle to meet payroll and vendor payments.
I’ve found the quick ratio particularly useful for identifying companies heading for trouble. A declining quick ratio often precedes problems by 12 to 24 months, giving attentive investors time to exit before the market notices.
7. Net Profit Margin
Net profit margin shows what percentage of revenue becomes profit after all expenses. A 15% margin means the company keeps $0.15 of every dollar in revenue as profit.
This ratio is straightforward but powerful. It captures the cumulative effect of pricing power, cost management, and operational efficiency. Companies with consistently high profit margins typically possess something valuable—a brand that commands premium pricing, an efficient operating model, or a monopoly-like market position.
Margins vary dramatically by industry. Software companies often show margins above 25% because their costs are primarily fixed (development) and scale efficiently. Grocery stores operate on thin margins, sometimes below 3%, because they’re essentially passing through suppliers’ pricing with minimal markup.
What matters is comparing companies within the same industry and tracking the trend over time. A company improving margins from 12% to 15% over five years is becoming more efficient or gaining pricing power. A company watching margins compress from 18% to 10% is likely facing competitive pressure or rising input costs.
I avoid companies with declining margins unless I have a clear explanation for why the trend will reverse. In my experience, margin compression is far easier to identify than margin expansion, and it’s usually a reliable signal to stay away.
8. Earnings Per Share (EPS)
EPS divides a company’s net income by its number of outstanding shares. If a company earns $1 billion and has 100 million shares outstanding, its EPS is $10.
The common mistake is treating EPS as a standalone indicator of value. A company with higher EPS isn’t automatically better than one with lower EPS—it might simply have more shares outstanding. The question is whether EPS is growing over time and whether that growth comes from genuine profitability increases or from financial engineering like stock buybacks.
Speaking of buybacks: I’ve seen investors fooled by EPS growth that results from reducing share count rather than improving business performance. A company can report rising EPS while the underlying business stagnates if it simply buys back shares. I always check whether earnings growth outpaces share count reduction.
I use EPS primarily for comparing companies within the same industry and for calculating other ratios (like P/E). It provides context but rarely drives an investment decision by itself.
9. Dividend Yield
Dividend yield calculates the annual dividend payment as a percentage of the stock price. A stock at $100 paying $4 annually in dividends has a 4% yield.
For income-focused investors, this ratio is central. But yield alone is misleading. A 7% yield might look attractive until you discover the company is cutting its dividend next quarter because the business is deteriorating.
I evaluate dividend yield in context. Is the payout ratio (dividends divided by earnings) sustainable? A company paying out 80% of earnings might be returning too much capital and underinvesting in the business. A company paying 30% is retaining plenty of cash for growth. What portion of the dividend is supported by free cash flow rather than debt?
The best dividend companies combine reasonable yields with consistent (and preferably growing) payouts. Johnson & Johnson has increased its dividend for over 60 consecutive years—not because of exceptionally high yield, but because the payout is rock-solid reliable.
High yields in volatile industries often signal trouble ahead. Real estate investment trusts (REITs) and bank stocks sometimes show elevated yields during crises—not as opportunities, but as warnings that the market expects dividend cuts.
10. Price-to-Sales Ratio (P/S)
The P/S ratio divides market cap by revenue. It tells you how much investors pay for each dollar of sales.
This ratio proves useful for companies that haven’t yet generated profits. A profitable tech company might have a P/E ratio, but a loss-making company has no earnings to price. P/S provides a valuation metric regardless of profitability.
Amazon famously traded at high P/S ratios for years while prioritizing growth over profits. Investors valued the company based on revenue expansion, trusting that profits would eventually follow. The P/S ratio allowed comparison to other high-growth companies where traditional earnings-based metrics wouldn’t work.
Like all ratios, P/S has limitations. A company with high sales but terrible cost control might still lose money. Revenue growth doesn’t guarantee profitability. And P/S doesn’t capture the capital intensity of a business—a retailer needs to constantly reinvest in inventory while a software company doesn’t.
I use P/S as one input among many, particularly for growth companies where earnings are volatile or nonexistent. A P/S below 1.0 for a stable business often signals undervaluation. A P/S above 10 for a company without profits implies extremely optimistic growth expectations.
How to Use These Ratios Together
No single ratio tells the complete story. I build a mosaic by examining these metrics in combination.
Consider a company with a low P/E (potentially undervalued) but a deteriorating ROE and rising debt levels. The low P/E might reflect a value trap—a seemingly cheap stock where underlying business quality is declining. Conversely, a company with a premium P/E and P/B might be fairly priced if its high returns on equity justify the valuation.
I recommend building a simple comparison spreadsheet. Track these ten ratios for companies you’re considering, plus at least three direct competitors. The patterns become visible immediately—some companies stand out as clearly expensive, others as potentially undervalued, and some require deeper investigation.
Common Mistakes Beginners Make
The biggest error is over-relying on any single ratio. A P/E of 15 looks cheap until you notice the company has been manipulating earnings through aggressive accounting. A dividend yield of 6% looks attractive until you see the payout ratio is 120% of earnings.
Another frequent mistake is comparing ratios across industries without adjustment. A grocery store with 2% profit margins isn’t worse than a software company with 25% margins—they operate in fundamentally different business models.
Finally, beginners often ignore debt. A company can show beautiful profit margins while accumulating debt that eventually threatens its survival. The 2008 financial crisis destroyed many “profitable” banks that had inadequate capital relative to their risk exposure.
Where to Find These Ratios
Every major financial website provides these ratios. Yahoo Finance, Morningstar, and Bloomberg offer comprehensive ratio data for publicly traded companies. SEC filings (10-K annual reports and 10-Q quarterly reports) contain the underlying numbers if you want to calculate them yourself.
I cross-reference data across multiple sources. Accounting differences can cause variations in how companies report numbers, and discrepancies often reveal important information about the company’s accounting practices.
Final Thoughts
These ten ratios form the foundation of fundamental analysis. They won’t make you an expert overnight—experience teaches you which ratios matter most in specific industries and how to spot the red flags that numbers alone can’t reveal.
The investors who succeed aren’t those who find the “perfect” ratio or magic formula. They’re the ones who consistently apply these tools, maintain skepticism about numbers that seem too good to be true, and recognize that financial analysis is an ongoing discipline, not a one-time calculation.
Start with these ratios. Build your own system for weighting and interpreting them. The learning curve is steep, but the alternative—investing without understanding what you’re buying—is far more expensive.


