
Free cash flow is the financial metric that separates investors who understand a business from those who only read headline numbers. While net income gets all the attention on income statements, long-term investors know that free cash flow tells the real story of a company’s ability to generate value, pay dividends, buy back shares, and fund growth without borrowing heavily. If you’re building wealth over decades rather than chasing next week’s earnings beat, understanding free cash flow isn’t optional—it’s essential.
This guide walks through what free cash flow actually means, why it matters more than almost any other metric for patient capital, how to calculate it yourself, and how to use it to find exceptional businesses.
What Exactly Is Free Cash Flow?
Free cash flow (FCF) represents the cash remaining after a company has paid for everything necessary to maintain and expand its operations. Think of it as the actual money the business could theoretically distribute to shareholders—whether through dividends, buybacks, or simply piling up in the bank—without harming its ability to keep running.
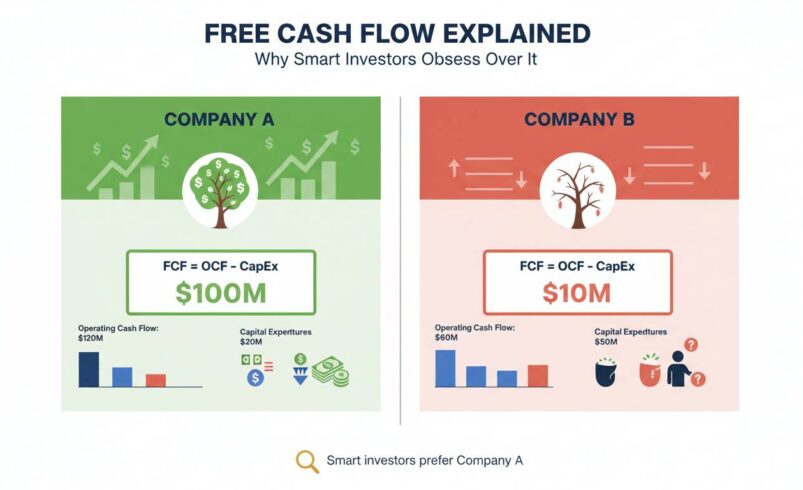
The basic formula is: Free Cash Flow = Operating Cash Flow − Capital Expenditures.
Operating cash flow appears on the cash flow statement and shows how much cash the company’s core business operations generated. Capital expenditures (often abbreviated CapEx) represent the cash spent on property, equipment, and other long-term assets needed to keep the business functioning and growing.
Here’s why this matters. A company can report healthy net income on paper while actually burning cash in reality. Consider a manufacturer that sells $100 million in products but spends $95 million on new machinery to maintain production. Net income might look respectable after accounting expenses, but the actual cash left over—the free cash flow—could be negative. That’s a business that’s technically profitable but functionally cash-hungry.
The distinction matters because cash, unlike accounting profit, can’t be manipulated as easily. Earnings management through aggressive accrual assumptions is a well-documented problem. But cash is harder to fake—either it’s in the bank or it isn’t.
Why Long-Term Investors Care More Than Short-Term Traders
Every metric serves a purpose, and for traders focused on quarterly earnings beats, net income or adjusted EBITDA often suffice. But for anyone building positions intended to last years or decades, free cash flow becomes the yardstick that reveals whether a business actually creates durable value.
FCF shows you what the business could do but chose not to. When a company reports $500 million in net income but generates $800 million in free cash flow, you have a business that’s producing real economic value beyond what accounting rules capture. That excess cash can fund dividend increases, share repurchases at attractive prices, acquisitions that compound returns, or simply strengthen the balance sheet against downturns. Net income, by contrast, includes non-cash charges like depreciation and stock-based compensation that don’t represent actual money available for distribution.
Free cash flow reveals the sustainability of competitive advantages. A business with a wide economic moat typically generates returns on invested capital well above its cost of capital, which naturally produces strong free cash flow. If you’re evaluating whether a company’s competitive position is deteriorating, watch FCF trends. Declining free cash flow as a percentage of revenue often signals that competitors are eroding pricing power or that the business is spending ever-more just to stand still.
Warren Buffett has repeatedly emphasized owner earnings—which functionally maps to free cash flow—as his preferred metric for valuing businesses. In his 1986 letter to Berkshire Hathaway shareholders, Buffett explained that “in evaluating the wisdom of… repurchases, the price paid is the all-important factor.” He described owner earnings as “the reported earnings minus all capital expenditures,” arguing this figure tells “what we think the unitowner could withdraw and spend without impairing his well-being.”
This perspective explains why long-term investors obsess over FCF. It’s not a quarterly vanity metric—it’s the fundamental measure of whether a business generates more cash than it consumes, year after year.
How to Calculate Free Cash Flow
Calculating free cash flow requires information from the cash flow statement, which publicly traded companies file quarterly with the SEC. Every investor should know how to find these numbers independently rather than relying on third-party data that may contain errors or outdated figures.
-
Find Operating Cash Flow. Look for “Cash Flow from Operations” or “Net Cash Provided by Operating Activities” on the cash flow statement. This represents cash generated from the core business before investment decisions.
-
Find Capital Expenditures. Look for “Capital Expenditures” or “Payments for Property, Plant and Equipment.” This figure shows cash actually spent, not the depreciation expense recorded on the income statement.
-
Subtract CapEx from Operating Cash Flow. The result is free cash flow.
Let me walk through a real example using Apple. For their fiscal year 2024, Apple reported operating cash flow of approximately $118 billion. Capital expenditures were approximately $22 billion. Subtracting CapEx gives free cash flow of roughly $96 billion. That’s nearly $96 billion in cash that Apple could have distributed to shareholders but chose to retain for other purposes—including funding one of the largest share repurchase programs in corporate history.
For a smaller example, consider a hypothetical manufacturing company with $50 million in operating cash flow and $30 million in capital expenditures. Its free cash flow would be $20 million. If this company has 10 million shares outstanding, that’s $2 per share in free cash flow. If the stock trades at $40 per share, the shares trade at 20 times free cash flow—a useful comparison to make against other investments.
Many financial data platforms calculate FCF automatically, but doing the math yourself at least once builds understanding you’ll never forget.
What Is a Good Free Cash Flow?
Context determines what “good” means. A utility company with stable, regulated revenue might generate modest but consistent FCF as a percentage of revenue—say, 8-12%—and that’s perfectly respectable for that business model. A high-growth software company might show negative free cash flow while investing heavily in expansion, which isn’t necessarily concerning if that investment promises substantial returns later.
What matters most is trend and consistency, not a single number. A business that generates 15% free cash flow margin this year but 2% next year warrants investigation. A company that consistently converts 15% or more of revenue into free cash flow year after year likely has a genuine competitive advantage.
Two ratios help contextualize FCF:
Free Cash Flow Yield divides free cash flow by market capitalization. A yield of 6% means the company generates enough free cash flow to theoretically return your investment in about 17 years through pure cash distribution—excluding any growth or share price appreciation. As a rough benchmark, a FCF yield significantly above the risk-free rate (currently around 4-5% for 10-year Treasuries) suggests an attractive, cash-rich business. Tesla, for instance, has historically traded at high multiples to FCF because investors expected future growth to expand the cash base substantially.
FCF as a Percentage of Net Income reveals how much of reported earnings translate to actual cash. A ratio consistently above 100% suggests conservative accounting or a business model that requires minimal reinvestment. A ratio below 80% might indicate aggressive capital intensity or earnings that include significant non-cash items. When Apple consistently generates free cash flow exceeding net income, that’s a signal of quality—the company’s earnings substantially understate the cash it actually produces.
Free Cash Flow vs. Other Metrics
Understanding what makes FCF distinct requires comparing it against the other numbers analysts cite constantly.
FCF vs. Net Income. Net income includes non-cash expenses like depreciation and amortization, but it also includes one-time items, stock-based compensation, and various accounting adjustments that affect the bottom line without reflecting actual cash movement. A company can report rising net income while generating declining free cash flow if it’s increasing working capital or accelerating capital investments. For long-term valuation, free cash flow is more reliable because it’s harder to manipulate and represents genuine purchasing power.
FCF vs. EBITDA. EBITDA (earnings before interest, taxes, depreciation, and amortization) is popular because it adds back non-cash charges, making comparison across companies with different capital structures easier. However, EBITDA ignores capital expenditures entirely—which is a massive oversight for capital-intensive businesses. An airline might show healthy EBITDA while actually burning cash on aircraft purchases. Free cash flow captures the full cash picture that EBITDA intentionally obscures.
FCF vs. Operating Cash Flow. Operating cash flow includes cash spent on capital expenditures, which can make a business appear healthier than it really is. A company spending $100 million on new factories might show $90 million in operating cash flow—positive by most measures—but its free cash flow would be negative $10 million. This distinction matters enormously when evaluating businesses that require continuous heavy investment just to maintain competitive position.
Real-World Examples
Let’s examine how free cash flow analysis works in practice by looking at two contrasting businesses.
Microsoft generated approximately $87 billion in free cash flow for fiscal year 2024—an enormous amount that reflects the company’s transition to cloud computing. Microsoft’s capital expenditures support Azure expansion, but the business generates far more cash than it reinvests. This cash fuels the company’s $60+ billion annual share repurchase program, substantial dividend payments, and acquisitions like Activision Blizzard. Investors value Microsoft partly because its free cash flow margin consistently exceeds 30% of revenue—a level few businesses achieve.
Amazon presents a different picture. While Amazon generates substantial operating cash flow, its capital expenditures have historically exceeded that amount, resulting in negative or minimal free cash flow. Amazon reinvests nearly everything into building logistics networks, data centers, and new business lines. Long-term investors accept this dynamic because they believe the reinvestment generates high returns—but it’s essential to recognize that Amazon’s business model differs fundamentally from a Microsoft or Apple. Amazon’s value depends on future cash flows from investments being made today, not current free cash flow generation.
This contrast illustrates why FCF analysis must be applied thoughtfully. Negative free cash flow isn’t automatically a warning sign—it depends entirely on whether the business is investing in high-return opportunities or simply burning cash to sustain operations.
Common Mistakes Investors Make
The biggest error is treating free cash flow as a standalone number without context. A rapidly growing company may show negative FCF because it’s building factories or hiring aggressively—that’s often a feature, not a bug. Meanwhile, a declining business might generate positive FCF temporarily by cutting back on maintenance capital, which destroys value over time.
Another mistake involves ignoring the cash flow statement entirely. Some investors focus only on the income statement, missing crucial information about whether reported earnings actually translate to cash in the bank. The cash flow statement is where corporate financial statements reveal their honest picture.
Finally, don’t confuse free cash flow with “owner earnings” in the Buffett sense, which may include a few additional adjustments for things like the cash cost of stock-based compensation. For most purposes, the standard FCF calculation suffices—but understanding that sophisticated investors make their own adjustments underscores why the headline number alone doesn’t tell the complete story.
The Bottom Line
Free cash flow isn’t the only metric that matters—revenue growth, return on invested capital, and management capital allocation all deserve attention. But if you master one financial concept that dramatically improves your investing, free cash flow is it. It tells you whether a business genuinely creates value that can be distributed to shareholders or reinvested at attractive rates. It exposes companies that look profitable on paper but consume cash in reality. And for long-term investors building portfolios intended to compound wealth over decades, understanding what cash a business actually produces is critical.
The next time you evaluate a potential investment, pull the cash flow statement and calculate free cash flow yourself. Compare it to the stock price. Look at the trend over five or ten years. Ask yourself whether the business model generates cash easily or requires constant capital infusion. Those answers will tell you far more than any PE ratio or earnings estimate alone.


