
Most investors encounter the P/E ratio within their first week of learning about stocks—and then spend years misunderstanding it. They’ll tell you a stock with a P/E of 15 is “cheap” and one with a P/E of 50 is “expensive” without ever questioning whether that framework makes sense. That’s the first mistake. The P/E ratio is not a price tag. It’s a tool that tells you how much the market is willing to pay for each dollar of a company’s earnings, and understanding the story behind that number is what separates investors who know what they’re looking at from those who don’t.
This guide covers what you need to use the P/E ratio effectively: what it measures, how to calculate it, why the “good versus bad” distinction is mostly a myth, and the specific scenarios where this metric becomes useful—and where it actively misleads you. I’ll use real stock examples so you’re not just learning abstract concepts but seeing how this plays out in the actual market.
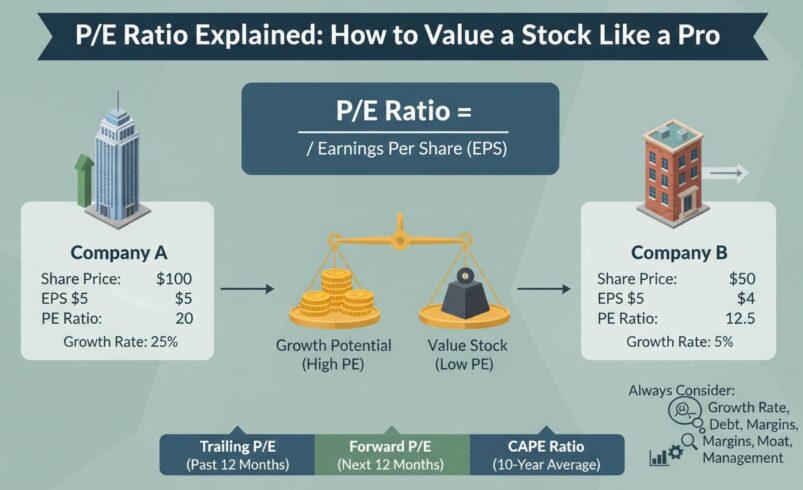
What Is P/E Ratio?
The price-to-earnings ratio compares a company’s current share price to its earnings per share. That’s the textbook answer, and it’s technically correct. But here’s what that definition leaves out: the P/E ratio is fundamentally a measure of market expectations. It answers the question, “What does the market think this company’s future is worth?”
When you see a P/E of 25, it means investors are currently paying $25 for every $1 of earnings the company produced over the trailing twelve months. That sounds straightforward until you realize what’s really happening—investors believe the company will grow its earnings significantly from here, which is why they’re willing to pay a premium. A P/E of 10, by contrast, suggests the market has lower growth expectations for that company, or that something is structurally weighing on its earnings outlook.
The formula is simple:
P/E Ratio = Share Price ÷ Earnings Per Share (EPS)
If Apple trades at $185 per share and its trailing EPS is $6.42, the P/E is 28.8. That’s a real number from early 2025. Now, is that expensive? The answer depends entirely on what you’re comparing it against and what expectations are already baked in—which is exactly what we’ll get into.
How to Calculate P/E Ratio: Finding the Numbers
Calculating a P/E ratio requires two pieces of data: the current stock price and the earnings per share. Both are readily available on any financial data platform, but understanding where the earnings figure comes from matters more than most investors realize.
There are two common sources for the EPS number, and this distinction creates the difference between trailing P/E and forward P/E.
Trailing P/E uses earnings from the past twelve months. If you’re reading this in 2025, trailing EPS reflects what the company actually earned over the most recent fiscal year or four quarters. This is historical data—real numbers that already happened.
Forward P/E uses projected earnings for the next twelve months. Analysts estimate what the company will earn, and that forecast becomes the denominator. Forward P/E is inherently speculative because analyst estimates are frequently wrong, sometimes dramatically so.
To calculate trailing P/E yourself, take the stock price and divide by the trailing EPS figure. For example, Microsoft trades around $415 as of early 2025 with a trailing EPS of approximately $12.80, giving it a trailing P/E of roughly 32.4. A forward P/E based on analyst estimates of $14.50 EPS for the next year would show 28.6—meaning the market is pricing in earnings growth.
This gap between trailing and forward P/E is one of the most useful things to examine. A large gap suggests the market expects significant earnings growth. A small gap or inverted relationship (forward P/E higher than trailing) often signals that analysts have cut their estimates or that the market is pricing in an earnings slowdown.
Understanding the Two Types: Trailing vs Forward P/E
The distinction between trailing and forward P/E isn’t academic—it fundamentally changes what the ratio tells you about a stock.
Trailing P/E reflects what actually happened. It’s useful because the earnings figure is verified, reported, and can’t be wishfully estimated. When a company’s trailing P/E is unusually low relative to its history or peers, it might signal an opportunity—or it might mean the market sees something wrong that you haven’t noticed yet. Trailing P/E is the most commonly cited version because it’s objective. You can’t argue with what already happened.
Forward P/E is predictive. It incorporates what analysts think the company will earn, which means it’s only as good as those estimates. During periods of economic uncertainty, analyst estimates tend to be aggressively optimistic, making forward P/E ratios artificially low. Conversely, after earnings have been cut repeatedly, forward P/E can appear high even as the stock is reasonably priced because the denominator (expected earnings) has been dragged down by overly pessimistic forecasts.
Professional investors typically look at both. When trailing and forward P/E diverge significantly, that’s your first clue that something interesting is happening with expectations. A tech company with a trailing P/E of 40 and forward P/E of 25 is being priced for earnings stagnation or decline despite strong current results. A utility company with a trailing P/E of 15 and forward P/E of 14 probably has stable, predictable earnings that the market expects to maintain.
Neither type is universally “better.” Trailing P/E is more reliable but backward-looking. Forward P/E is more relevant for where the company is going but requires you to trust analyst estimates or form your own views.
What Is a Good P/E Ratio?
Here’s where most beginner investors go wrong: they look for a single “good” P/E number and apply it everywhere. That approach fails because P/E ratios vary dramatically across sectors, growth stages, and market conditions.
Technology companies routinely trade at P/E ratios of 30, 40, or higher. Amazon’s P/E has hovered around 45-60 in recent years. Nvidia’s P/E exceeded 60 during the AI boom of 2023-2024. These aren’t “expensive” in any absolute sense—they’re pricing in rapid earnings growth that justifies those multiples.
Consumer staples and utilities, by contrast, typically trade in the 15-25 range. Procter & Gamble has bounced between 20 and 30 for years. Utilities often sit in the high single digits to low twenties. These lower multiples reflect slower growth expectations, not inherent “cheapness.”
The useful comparison isn’t to an arbitrary number—it’s to:
- The company’s own historical P/E range — If a stock typically trades at 25 and now sits at 18, something has changed. Either expectations have shifted, or the market is missing something.
- Peer group P/E — Comparing Apple’s P/E to Microsoft’s makes sense. Comparing Apple’s P/E to Ford’s doesn’t, because they’re in different industries with different growth trajectories and capital structures.
- The broader market — The S&P 500 P/E ratio has historically averaged around 15-20. A P/E significantly above that suggests elevated expectations; significantly below might indicate a discount or a value trap.
There’s no universal threshold for “good.” A P/E of 40 can be cheap for a fast-growing company and absurdly expensive for a stagnant one. That’s not a cop-out—it’s the actual answer, and accepting it will make you a better investor.
When P/E Ratio Misleads: The Limitations You Need to Know
The P/E ratio has blind spots that trip up investors who treat it as a standalone valuation metric. Here are the situations where it actively misleads:
Cyclical companies are the classic example. Banks, automakers, and commodity producers earn wildly different profits across economic cycles. During boom years, their earnings spike and P/E ratios plummet to single digits—which looks like a bargain but actually marks the peak of the cycle. During downturns, earnings collapse and P/E ratios spike even as the stock gets more expensive in terms of future potential. Looking at a cyclical company’s P/E in isolation tells you almost nothing useful.
Companies with negative earnings break the calculation entirely. A company losing money has no EPS to divide into the price, resulting in a negative P/E or no P/E ratio at all. Growth companies, especially in sectors like biotech or early-stage tech, frequently operate at losses. Using P/E to evaluate them is meaningless—revenue growth, cash flow, and addressable market size matter far more.
One-time accounting items distort earnings in ways that make P/E temporarily useless. If a company takes a massive impairment charge in one quarter, its reported earnings drop and P/E spikes—even if the underlying business is fine. Conversely, a one-time gain inflates earnings and deflates P/E artificially. Experienced investors add back these items to examine “normalized” earnings.
Different capital structures make cross-company comparisons dangerous. A company with significant debt carries higher risk and may deserve a lower P/E than a debt-free peer. A company with heavy intangible assets (acquired software, intellectual property) may have book value that doesn’t reflect its earning power. P/E doesn’t adjust for any of this.
Growth at any price is the trap that catches momentum investors repeatedly. A company growing earnings at 50% per year might deserve a P/E of 50—but only if that growth continues. When growth slows, the P/E contracts violently. Nokia traded at 70 P/E in 2007. By 2012, after the smartphone revolution passed it by, the stock traded at single-digit earnings multiples and lost over 80% of its value. High P/E requires high growth to justify it, and growth is the hardest thing to sustain.
How to Use P/E Ratio to Value a Stock: Practical Application
Now for the part that actually matters: putting this into practice. Here’s how professional investors think about P/E in the real world:
Step one is context, not calculation. Before computing anything, you need to understand the company. Is it growing fast or slow? Is it cyclical or stable? Does it have a strong competitive position or a vulnerable one? A P/E ratio is useless without this context. You’re not looking for a number—you’re looking for a number that makes sense given what you know about the business.
Step two is comparison within reason. Once you understand the business, compare its P/E to appropriate peers. Not just any competitors—companies with similar growth rates, margins, and risk profiles. Amazon doesn’t compete with Walmart on valuation, and you shouldn’t compare their P/E ratios. Amazon competes with Microsoft, Google, and other high-growth platform companies.
Step three is looking for divergence. This is where P/E becomes powerful. If a company’s P/E has compressed significantly relative to its historical range or peer group, and nothing fundamental has changed with the business, you may have found a mispricing. Conversely, if a company’s P/E has expanded dramatically and the fundamentals haven’t improved proportionally, you may be looking at a stock that’s priced for perfection.
Step four is combining with other metrics. P/E works best as part of a toolkit, not a standalone answer. Combine it with:
- Price-to-free-cash-flow — harder to manipulate than earnings
- Price-to-book — useful for asset-heavy businesses
- Debt levels — high debt changes what a sustainable P/E should be
- Return on equity — tells you how efficiently the company generates earnings
- Dividend yield — for income-focused analysis
No single metric tells the whole story. The best investors build a mosaic of evidence rather than relying on one data point.
Real Examples: P/E in Action
Let’s look at how this works with actual companies to make it concrete.
Example 1: The “expensive” stock that was cheap. In 2023, Nvidia traded at a P/E exceeding 100 if you used trailing earnings. That looked absurdly expensive by historical standards. But Nvidia was riding an AI boom that was generating exponential revenue growth. Forward P/E based on 2024 earnings estimates dropped into the 30s and 40s. Investors who focused on the trailing P/E and called Nvidia “overpriced” missed one of the best-performing stocks of the decade. The key: the P/E was high because earnings were about to grow into it.
Example 2: The “cheap” stock that was a trap. In 2019-2020, many retail stocks like Macy’s traded at P/E ratios below 10. They looked cheap. But the underlying businesses were in structural decline from e-commerce competition. The low P/E reflected depressed earnings from a dying business model, not a bargain. Investors who bought expecting the low P/E to mean “undervalued” got crushed as earnings continued falling.
Example 3: The comparison that reveals truth. Compare two healthcare companies: a stable pharma giant like Johnson & Johnson (P/E around 15-20) versus a growth biotech like Moderna (P/E varies wildly, often negative during heavy R&D spending). The Johnson & Johnson P/E is “higher” but reflects a stable, predictable business worth a moderate multiple. Moderna’s P/E is nearly meaningless because biotech earnings are volatile and heavily invested in future pipeline development. You can’t compare them directly—but looking at both alongside revenue growth, pipeline value, and cash flow tells a much more complete story.
Frequently Asked Questions About P/E Ratio
Can a negative P/E be useful?
No—not in any straightforward way. A negative P/E means the company is losing money, and you can’t divide a positive price by negative earnings to get a meaningful ratio. Some platforms show “N/A” or simply leave it blank. For unprofitable companies, look at price-to-sales, price-to-book, or revenue growth metrics instead.
Is a low P/E ratio always better?
No. A low P/E often signals low growth expectations or underlying problems. It can also represent a genuinely undervalued company, but you need to investigate why the market is discounting it. Sometimes the market is right.
What is the average P/E ratio for the S&P 500?
The index typically trades between 15 and 25 P/E over long time periods, though it’s been higher in recent years (above 25 as of early 2025) during the AI-driven bull market. The historical average since the 1990s is approximately 19-20.
Should I only buy stocks with low P/E ratios?
No. This “value investing” approach works over long periods but has significantly underperformed growth strategies during certain decades. The best approach is to evaluate whether a P/E makes sense given the company’s growth rate, competitive position, and industry dynamics—not to automatically avoid high P/E stocks.
How do I find P/E ratios for specific stocks?
Every major financial website displays P/E ratios prominently. Yahoo Finance, Google Finance, Bloomberg, and brokerage platforms all show both trailing and forward P/E. You can calculate forward P/E yourself by dividing the stock price by analyst EPS estimates for the next twelve months.
The Bottom Line
The P/E ratio is one of the most widely cited metrics in investing—and one of the most commonly misused. It works best not as a standalone decision tool but as a lens for understanding what the market expects from a company. A high P/E means the market expects growth; a low P/E means it doesn’t. Whether those expectations are correct is the real question, and answering it requires understanding the business, the industry, and the competitive landscape.
What separates investors who know what they’re doing from those who don’t isn’t that they use different metrics—it’s that they don’t stop at the surface number. They ask why the P/E is where it is, what expectations are embedded in it, and whether those expectations are reasonable. The ratio itself is just a starting point.
As you develop your own investment process, use P/E as one input among many. Compare it to historical ranges and peer groups. Look at both trailing and forward versions to understand where expectations are heading. And remember: the goal isn’t to find stocks with the lowest P/E. It’s to find stocks where the P/E doesn’t match reality—and where you have conviction that reality will eventually prevail.


