
The Crypto Fear and Greed Index is a daily sentiment gauge that tries to answer one simple question: are crypto traders feeling terrified or euphoric right now? It crunches multiple data sources into a single number between 0 and 100, giving you a quick snapshot of market psychology. It won’t tell you exactly when to buy or sell, but it can help you understand where emotions stand.
This guide covers everything about the index, from how it’s calculated to practical ways to use it in your trading.
What Is the Crypto Fear and Greed Index?
The Crypto Fear and Greed Index is a market sentiment indicator that pulls from several data sources to produce a single score showing the prevailing emotional state of the cryptocurrency market. The scale runs from 0 to 100, where 0 means “Extreme Fear” and 100 means “Extreme Greed.”
Alternative.me launched this index in late 2018. Traditional stock markets had sentiment gauges, but crypto markets—with their 24/7 trading and retail-driven swings—needed something different.
The index updates daily at 00:00 UTC. You can check the current reading at alternative.me/crypto/fear-and-greed-index/, where you’ll see the value displayed with a color-coded gauge and a historical chart.
The basic idea: extreme fear often signals buying opportunities, while extreme greed often comes before corrections. It’s Warren Buffett’s advice—”be fearful when others are greedy and greedy when others are fearful”—applied to crypto.
Understanding the 0-100 Scale
The scale breaks into five zones with different implications:
Extreme Fear (0-25): Traders are panicking. Prices have dropped, negative sentiment dominates, and fear is driving decisions. This zone has marked market bottoms before—including the December 2018 crash and the COVID-19 crash in March 2020, when the index hit 8.
Fear (25-50): Still bearish. Investors worry about more losses, and selling pressure outweighs buying interest. Longer-term investors might see this as a cautious buying zone.
Neutral (50): Balanced sentiment—neither fear nor greed dominates. Markets tend to move sideways during these periods.
Greed (50-75): Optimism is building. Prices are rising, FOMO is creeping in, and confidence is growing. This can last for extended periods during bull runs, which is why many traders treat greed as a warning sign rather than a green light.
Extreme Greed (75-100): Danger zone. Participants are irrationally optimistic, prices may be decoupling from fundamentals, and speculation is running wild. Every major crypto top in the index’s history has shown readings above 75, often hitting 90+ in the final frenzied stages.
How the Index Is Calculated
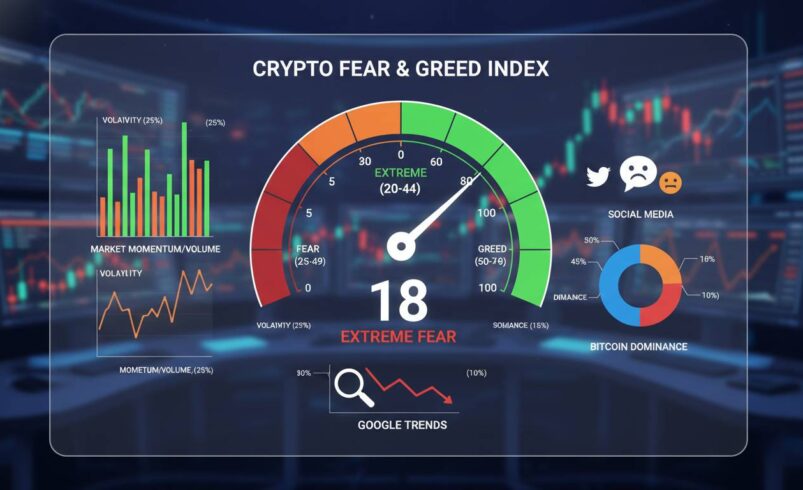
The index draws from five data sources, each weighted differently:
Volatility (25%): Measures current Bitcoin volatility against its 30-day and 90-day averages. Unusual spikes—particularly downward—contribute to fear. Sudden, sharp price movements scare investors.
Market Momentum and Volume (25%): Looks at current buying and selling volume against recent trends. Strong buying momentum pushes toward greed; declining volume and negative momentum contribute to fear.
Social Media (15%): Analyzes Reddit and Twitter discussions, tracking frequency and sentiment of crypto posts. A surge in excited, bullish language increases greed; dominant negative sentiment adds to fear. Alternative.me uses custom algorithms to filter out spam.
Surveys (15%): Weekly polls of crypto investors conducted by Alternative.me. This adds a human element, though participation has been low at times and the component has been paused. When active, it provides ground-truth data on retail sentiment.
Market Dominance (10%): Measures Bitcoin’s dominance ratio—the percentage of total crypto market cap held by Bitcoin. Rising dominance typically indicates fear (investors fleeing to safety), while falling dominance suggests greed (investors confident enough to speculation on altcoins).
Trends (10%): Analyzes Google Trends data for Bitcoin-related searches. Spikes in “Bitcoin crash” or “Bitcoin hack” increase fear; searches for “buy Bitcoin” contribute to greed.
The methodology has stayed largely consistent since launch, though Alternative.me has made incremental tweaks.
How to Read and Use the Index in Trading
Reading the index is simple. Interpreting it wisely is harder.
The most common mistake is treating it as a direct buy/sell signal. It doesn’t work that way. The index measures current sentiment, not future price action. Extreme fear can last weeks or months before markets bottom. During the 2022 crypto winter, the index bounced between fear and extreme fear for months without any meaningful bottom-forming rally. Buying every time it hit 20 would have meant significant unrealized losses before recovery.
Here are some practical uses:
Contrarian Entry Points: When the index hits extreme fear (below 25) and you’ve done your fundamental homework, it often marks a reasonable time to accumulate. You’re buying when others are panicking—the strategy that’s produced long-term gains in every asset class.
Exit Warning Signs: Extreme greed (above 75) should make you question whether your position sizing fits a potential pullback. It doesn’t mean you must sell, but it suggests tightening stop-losses or taking some profits.
Market Cycle Identification: Extended periods in the extreme zones can signal cycle extremes. The 2021 bull market hit 95+ multiple times before the November top. Similarly, deep fear readings during major crashes have preceded recovery periods.
Confirmation, Not Prediction: Use the index to confirm your existing thesis rather than generate new signals. If technical analysis suggests a support level, extreme fear at that level strengthens the case for entry. If greed is running high as you approach resistance, it may warrant caution.
What the index can’t do: predict specific price targets, time precise bottoms, or account for macroeconomic events. It measures sentiment, not fundamentals or technicals. The best traders use it as one input among many.
Limitations and Criticisms
The index has real limitations worth acknowledging.
First, it’s heavily Bitcoin-centric. With 25% tied to Bitcoin dominance and the volatility component measuring primarily Bitcoin, it may not reflect sentiment in the broader market. During 2021’s altcoin season, Bitcoin could be in fear while Dogecoin, Shiba Inu, and other tokens surged. Using the index to gauge the entire crypto market in those periods would have given you a distorted picture.
Second, it lags behind real-time sentiment. The daily update means you’re getting yesterday’s emotion, not today’s. In fast-moving markets, sentiment can shift within hours.
Third, the survey component has reliability issues. Small sample sizes and self-selection bias mean the survey data may not represent the broader trading population accurately. Alternative.me has acknowledged this.
Fourth, the index can stay extreme for surprisingly long periods. Markets don’t simply mean-revert because sentiment indicators say they should. The 2021 bull market spent weeks at extreme greed before finally topping out—those who called the top too early based on the index alone missed significant further gains.
Fifth, whale manipulation is a real concern. Large traders can influence the components the index measures—particularly social media sentiment and potentially volume—creating readings that don’t reflect genuine market psychology.
Historical Performance
Looking at past readings shows how the indicator has performed during actual market events.
During the December 2018 crash, when Bitcoin fell from $6,000 to roughly $3,200, the index hit 9—correctly signaling extreme panic before the recovery. Investors who bought near that bottom saw significant gains over the following years.
The March 2020 COVID crash provides another data point. As global markets panicked and Bitcoin plummeted from $9,000 to under $5,000 in days, the index dropped to 8. Within months, Bitcoin had surpassed its previous highs.
The November 2021 all-time high tells a different story. As Bitcoin approached $69,000, the index hit 95—extreme greed. The subsequent decline erased roughly 75% of Bitcoin’s market cap over the following year. Extreme greed readings at market tops have been remarkably consistent.
However, the 2022 bear market shows the index’s limits. It hit multiple extreme fear readings throughout the year—including readings below 20 in June 2022 during the Terra/Luna collapse—yet markets kept declining for months afterward. Extreme fear alone doesn’t guarantee an immediate bottom.
These examples illustrate the pattern: extreme readings mark conditions worth noting, not precise timing signals.
Practical Tips for Using the Index
If you want to incorporate the index into your trading approach, these considerations may help:
Track it alongside your existing strategy rather than replacing it. If you’re a technical analyst, use extreme readings to add conviction to setups near support. If you’re a fundamental investor, use extreme fear as a reminder to review your watchlist for quality projects that have been beaten down.
Note the duration of extreme readings. A single day at extreme fear means less than a week of sustained extreme fear. Extended periods in the extremes have historically preceded more significant reversals.
Watch for divergences between price and the index. If Bitcoin makes a new low but the index doesn’t hit extreme fear, it could signal weakening downside momentum—or alternatively, that sentiment has become so beaten down that even new lows can’t push fear higher. Both interpretations have historical precedent.
Use multiple timeframes. The daily index is useful for longer-term positioning, but you can also track weekly or monthly averages to smooth out noise and identify more significant shifts.
Frequently Asked Questions
What does a score of 20 mean?
A score of 20 indicates extreme fear—significant price declines, negative news coverage dominating, and investors panicking about further losses. Historically, this has often marked buying opportunities, though not always immediate ones.
Is the index reliable for predicting market movements?
It’s more reliable for identifying extreme conditions than predicting specific price movements. It’s marked market bottoms with extreme fear and tops with extreme greed consistently, but it can’t predict exactly when reversals will occur or how large they’ll be.
How often is it updated?
Daily at 00:00 UTC. Some data providers offer more frequent updates or hourly approximations, but the official reading comes out once per day.
Can it predict crashes?
The index has correctly identified conditions that preceded major crashes—extreme greed appeared before every major crypto top since launch. However, it can’t predict when crashes will happen or how severe they’ll be. Many periods of extreme greed have also resolved without major crashes, continuing into even more extreme greed.
Should I buy when the index shows extreme fear?
Many traders use extreme fear as a signal to look for buying opportunities, but this should be combined with your own analysis of the underlying asset and broader market conditions. Extreme fear can persist for extended periods, so position sizing and risk management remain essential.
Final Thoughts
The Crypto Fear and Greed Index offers a useful window into market psychology, combining multiple data sources into a single readable metric. Understanding what drives it—the interplay between volatility, momentum, social sentiment, surveys, dominance, and trends—helps you evaluate what it’s actually measuring.
The honest assessment: it’s a tool, not a crystal ball. It excels at identifying when markets have reached emotional extremes, which has often preceded reversals. But it can’t tell you exactly when to buy or sell, and treating it as a complete trading system will lead to frustration.
What it can do is keep you aware of the emotional climate you’re operating within. When everyone around you is panicking, the index confirms that panic. When euphoria is everywhere, it shows you just how extreme that euphoria has become. That awareness—combined with solid analysis and disciplined risk management—makes the Fear and Greed Index worth watching, even if it never becomes your sole decision-making framework.


