
This guide breaks down exactly how stock prices are set, why they move constantly, and what actually happens when you click “buy.” I’ll cover the core mechanics first, then the factors that create movement, and finally the practical implications for anyone holding a position.
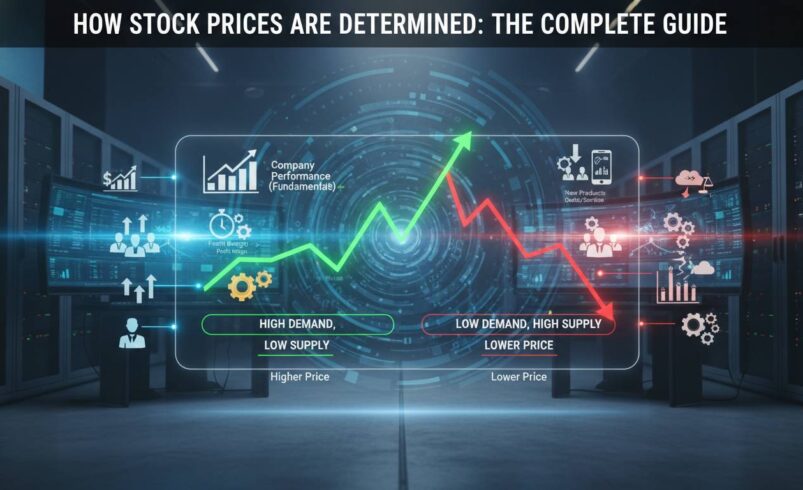
The supply and demand balance is the foundation. Every stock price exists at the intersection of two forces: the number of people wanting to buy at a given price and the number of people wanting to sell. That’s it. Everything else—the company’s fundamentals, the broader economy, the CEO’s latest interview—all matters only to the extent that it changes how buyers and sellers position themselves.
When more investors want to buy a stock than sell it, the price climbs. When selling pressure overwhelms buying interest, it falls. This sounds simple, and it is, but the implications get weird quickly. A stock trading at $50 doesn’t have a single “correct” price. It has an equilibrium that shifts constantly as new information reaches participants and as their circumstances change.
Consider Apple in late 2024. The stock didn’t jump because Apple released a product that was objectively better than what existed before. It jumped because enough market participants believed the product would generate more revenue than previously expected, and that belief translated into more buy orders than sell orders at current prices. The price change happened first—the fundamental reevaluation followed.
This inverted logic trips up most beginners. They search for the “fair value” of a stock and treat any deviation from that number as a buying or selling signal. In reality, the price is what the market says it is at this moment. Your job isn’t to find the “real” price and wait for the market to catch up. It’s to understand what the current price reflects and what would need to change for it to move.
The bid-ask spread is where most people get confused about how trades actually execute. If you look at any stock quote, you’ll see two prices: the bid and the ask. The bid is the highest price someone is currently willing to pay to buy the stock. The ask is the lowest price someone is willing to accept to sell it. The difference between them is called the spread.
For a heavily traded stock like Microsoft, the spread might be just a penny. For a smaller company with lower daily volume, it could be several cents or even a percentage point. Every time you execute a market order—a request to buy or sell immediately at the best available price—you’re accepting whatever the ask is at that moment. You’re not negotiating. You’re accepting the current supply.
Here’s where it gets interesting: the bid and ask aren’t static. They’re standing orders from market participants. When you place a market buy order, it gets matched against the lowest available ask. When you place a market sell order, it matches against the highest bid. The price you get is whatever was sitting there waiting.
Market makers are the people and firms that ensure there’s always a bid and ask available. They make money from the spread—they buy at the bid and sell at the ask, collecting the difference. Their presence is why you can almost always immediately execute a trade, even in otherwise illiquid stocks. They’re absorbing the risk that they’ll be stuck holding a position they can’t immediately offload.
This is why a market order can “slip.” You see a stock trading at $50 and hit buy. By the time your order reaches the exchange, the existing ask might have been filled by someone else. Your order now matches the next available ask at $50.02. That two-cent slippage is invisible to casual observers but adds up significantly at scale.
Prices change every second because information reaches the market continuously, and participants react to that information at different speeds. When a major news event breaks—say, an unexpected earnings miss from a large company—some traders have algorithms that react within milliseconds. Others won’t see the news for hours. This creates a cascade effect: early movers push the price, that movement triggers other signals, and the price continues adjusting until a new equilibrium is reached.
The continuous auction model means there’s no “closed” price that represents the stock’s true value. The closing price on any given day is simply where the last trade happened to execute. It could have been a tiny order that didn’t represent the broader market’s view. The next morning’s opening price often gaps significantly from the previous close because overnight information shifted the equilibrium.
This is why watching a single price point all day is rarely useful. The number on your screen is a snapshot of a negotiation that involves millions of participants, any of whom can change their mind at any moment.
Here’s what actually creates shifts in supply and demand:
Earnings and financial performance are the most direct driver. When a company reports results that exceed expectations, the immediate reaction is usually positive—more buyers enter, pushing the price up. But this effect is notoriously fickle. Amazon’s stock has dropped after earnings multiple times despite beating estimates, because the market was expecting even better results.
Economic data moves entire markets simultaneously. Interest rate decisions, inflation reports, employment numbers—these don’t just affect one stock, they recalibrate what investors expect from everything. A Federal Reserve rate hike announcement in December 2024 sent ripples through nearly every sector as traders repriced the cost of capital.
Company-specific news matters more than most beginners realize. A product launch, a regulatory decision, a leadership change, or even a viral social media post can move a stock dramatically and immediately. When a small biotech announces FDA approval for a drug, the stock can double in hours, even though the company’s revenue hasn’t changed yet.
Market sentiment is the hardest factor to quantify but often the most powerful in the short term. During the meme stock phenomenon of early 2021, companies like GameStop moved based on crowd psychology rather than any fundamental shift. Prices can rise simply because prices are rising, until they can’t.
Sector rotation moves stocks in waves. When energy prices surge, energy stocks generally benefit while consumer discretionary stocks may suffer. These correlations aren’t perfect, but they create predictable flows that affect individual stock prices.
The critical insight here is that these factors don’t move prices directly. They move prices by changing the balance of buyers and sellers. A positive earnings report doesn’t automatically increase a stock price—it increases buying interest, which overwhelms selling pressure, which increases the price.
How you place an order matters as much as what you order. Most beginners use market orders because they’re simple—you say buy, it buys. But this simplicity has a cost.
A market order guarantees execution but not price. You’re saying “get me in at whatever the current price is.” In a fast-moving market, that can mean paying significantly more than you expected.
A limit order lets you specify the price you’re willing to accept. You set your maximum buy price or minimum sell price, and the order only executes if the market reaches that level. The tradeoff: your order might not execute at all if the price never reaches your level.
For most individual investors, limit orders are the better choice, especially for positions you’re building over time. The savings from avoiding slippage compound significantly. I rarely use market orders anymore, even for relatively liquid stocks. The few seconds of waiting for a limit order to fill is worth the price certainty.
Here’s a practical example: you want to buy NVIDIA at $120. You place a limit order at $120. If the stock drops to that level, your order fills. If it drops to $119.50, you’re even better off because your order executes at the lower price. If it never drops to $120, you don’t buy—which might be the right decision if your thesis was wrong anyway.
Behind every stock price is a hidden layer of information: the order book. This shows all the pending buy and sell orders at various price levels, not just the best bid and ask. Understanding this depth reveals a lot about how a stock might move.
When there’s strong buying pressure but few sellers, the price moves up quickly. When there are many sellers waiting to unload at higher prices, the upward movement stalls. This is why stocks often “run into resistance”—price levels where sell orders have accumulated act as a ceiling.
Volume matters because it represents the intensity of conviction. A price move on low volume suggests weak conviction—it might reverse just as easily. A move on high volume suggests more participants are acting on that information, making the move more durable.
For individual investors, volume analysis is useful for timing but dangerous as a sole indicator. Large players can create false signals by manipulating volume temporarily. The key is using volume as one input among many rather than a crystal ball.
Every trader has experienced this: you check the market at the end of the day, the stock closed at $100, and you wake up to find it’s trading at $105. What happened?
Gaps occur when there’s been a significant shift in the equilibrium overnight. An earnings report released after the market closed, a political event, or major economic data—any of these can change the supply-demand balance enough that the opening price is substantially different from the previous close.
Unlike the continuous trading session, the opening doesn’t happen against a live order book. There’s an auction process, but it happens quickly, and the opening price can move dramatically from the previous close.
The practical implication: stop-loss orders don’t protect you from gap moves. If you set a stop-loss at $95 and the stock gaps down to $90, your order executes at $90, not $95. There’s no way to guarantee a specific exit price in fast-moving markets. This is why position sizing matters—you need to be able to absorb a gap move against you without catastrophic damage.
A stock can show heavy volume and tight spreads and still be dangerously illiquid when you need it to be. This sounds contradictory, but it reveals something important about how markets work.
At any given moment, the number of shares actually available at the best prices is finite. If you try to buy a million shares of a small-cap stock, you’ll consume not just the best ask but every ask above it, pushing the average price you pay significantly higher than the quoted price. The market can’t absorb large orders without moving.
This is why institutional investors split their orders across time and across multiple brokers. They’re trying to hide their intentions from the market and avoid moving prices against themselves. As an individual investor, you’re usually moving small enough sizes that this isn’t a concern—but it explains why the price impact of large trades shows up over time rather than immediately.
Understanding how prices are determined changes how you approach investing. The price isn’t a truth to be discovered—it’s a negotiation to be observed. Your edge comes not from knowing what the price should be but from understanding what the current price reflects and what would cause that to change.
Position sizing matters more than stock picking. Even the best thesis can be wrong, and gap moves can devastate concentrated positions. Diversification across unrelated positions with appropriate sizing gives you staying power when the market moves against you.
Timing the market is nearly impossible, but understanding the mechanisms helps you avoid the worst timing. When everyone is panicking, the auction is heavily skewed toward sellers—you can use that to get favorable entries. When euphoria is high, you’re likely buying at a peak of the equilibrium.
The market will always seem like it’s making irrational decisions. Sometimes it is. But more often, the price reflects information and sentiment that you don’t have yet. Rather than fighting that reality, successful investors learn to read it.
The mechanics of stock pricing haven’t changed fundamentally in decades, but the tools and speed have. Algorithmic trading now accounts for the majority of volume in US markets. High-frequency traders compete for milliseconds. The basic auction model remains, but the participants have evolved.
What hasn’t changed is the human element. Behind every algorithm is a person who wrote it. Behind every data feed is a human interpreting it. The market is a massive collection of predictions about the future, and those predictions are only as good as the information and psychology driving them.
If there’s one thing to take away from this entire guide, it’s this: the price you see is the current consensus, not a permanent verdict. Your job as an investor isn’t to find the “correct” price—it’s to develop your own thesis about what the future holds and understand whether the current consensus agrees with you. When it doesn’t, that’s either an opportunity or a warning, depending on how much confidence you have in your own analysis.


